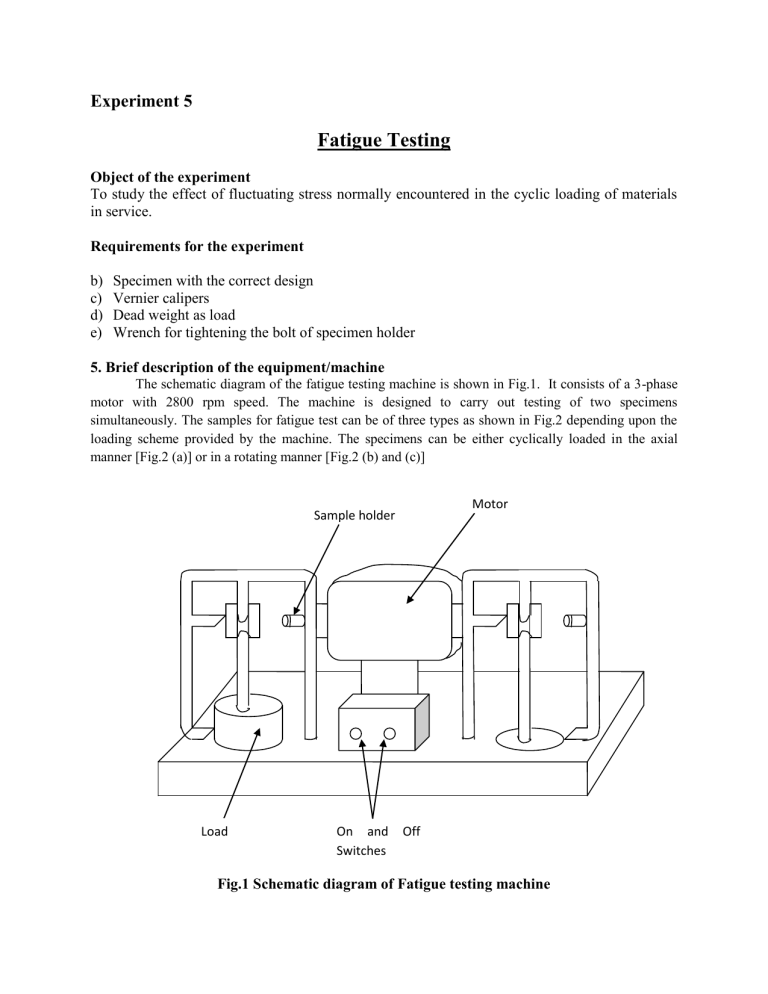
Experiment 5 Fatigue Testing Object of the experiment To study the effect of fluctuating stress normally encountered in the cyclic loading of materials in service. Requirements for the experiment b) c) d) e) Specimen with the correct design Vernier calipers Dead weight as load Wrench for tightening the bolt of specimen holder 5. Brief description of the equipment/machine The schematic diagram of the fatigue testing machine is shown in Fig.1. It consists of a 3-phase motor with 2800 rpm speed. The machine is designed to carry out testing of two specimens simultaneously. The samples for fatigue test can be of three types as shown in Fig.2 depending upon the loading scheme provided by the machine. The specimens can be either cyclically loaded in the axial manner [Fig.2 (a)] or in a rotating manner [Fig.2 (b) and (c)] Motor Sample holder Load On and Switches Off Fig.1 Schematic diagram of Fatigue testing machine Fig.2 Loading schemes for laboratory scale fatigue testing: (a) Axial loading of the specimen, (b) single-end rotating cantilever testing machine and (c) Four-point rotating cantilever testing machine Important Parameters and Equations A fluctuating stress cycle can be considered to be made up of two components, a mean or steady stress σm, and an alternating or variable stress σa. We must first consider the range of stress σr. As can be seen from Fig. 3a & 3b, the range of stress is the algebraic difference between the maximum and minimum stress in a cycle. Thus, σr = σmax – σmin The alternating stress is one half of the range of stress. σa = σ r σ max σ min 2 2 The mean stress is the algebraic mean of the maximum and minimum stress in the cycle. σm σ max σ min 2 Two other parameters are also used for representing fatigue data: Stress Ratio (R) = σ min σ max Amplitude ratio (A) = σa 1 R σm 1 R For a fully reversed stress cycle, as shown in Fig.3 (a), the Stress Ratio, R is -1 and if the stresses are partially reversed, R becomes a negative number less than 1. If the stress is cycled between a maximum stress and no load, the stress ration becomes zero. If the stress is cycled between two tensile stresses, the stress ratio becomes a positive number less than 1. Fig 3. Typical fatigue stress cycles. (a) Reversed stress; (b) repeated stress; (c) irregular or random stress cycle The results of fatigue crack initiation tests are usually plotted as maximum stress, minimum stress or the stress amplitude on (y-axis) against the number of cycles to failure, N (on the x-axis). The number of cycles to failure is generally plotted on the logarithmic scale, while stress is plotted either on the linear or logarithmic scale. The regime in which the peak load is above the yield strength of the material is referred to as the low cycle fatigue. Components usually endure <104 cycles during low cycle fatigue. In contrast, when the peak cyclic stress is below the yield strength of the material, the component undergoes more than 104 cyclic reversals and the regime is referred to as the high cycle fatigue. Fig.4 depicts some of the general characteristics of fatigue. Fig5. Some of the important characteristics of fatigue The peak stress in case of cantilever bar testing is obtained by the following formula. For the four-point cantilever bending the peak stress, σais given by 32Mb πd 3 Where Mb is the bending moment =PI/2, d is the diameter of the sample, P is the applied load L is the length of the sample. For the single-end cantilever testing σa 32Px πd 3 Where x = distance along the length from the fixed end and maximum value of x is 1 σa Experimental Procedure a) Polish the sample surface as smooth as possible and observe for any surface defects and deep scratch/machining marks. Reject the sample if you find any defects. b) Measure dimensions of the given specimen of mild steel. c) Fit the specimen is in the sample holder such that it passes through the opening provided in the rod on which the loads are seated. d) After fitting the sample, keep the desired load on the seat provided for the loads. e) Switch on the instrument to conduct the fatigue test and record the time for the failure, when it occurs,. f) Note the appearance of the fractured surface in each case. Experimental Date Collection and Presentation e) Calculate the peak stress from the formula mentioned above. f) From the time taken for fatigue failure, calculate the number of cycles to failure [N = RPM x time for failure(min)]. g) Report the value of σa and N. h) Report the appearance of the fractured surface. i) Make S-N plots using results of all the batches and obtain the endurance limit. 9. Significance of the experiment/conclusions The fatigue tests of mild steel will give the value of stress below which it can endure infinite number of cycles which is important from the engineering design point of view.


