Name: ______________________________
Reading and Interpreting Graphs
Worksheet
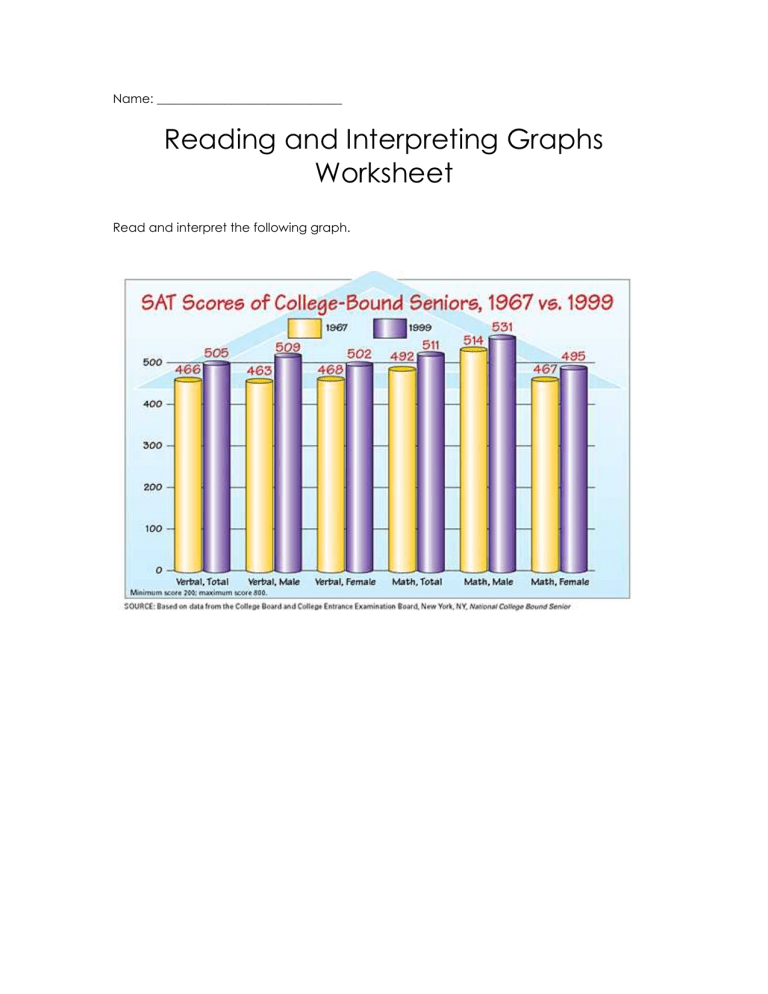
Read and interpret the following graph.
1. What do the light and dark bars represent?
________________________________________________________________________
________________________________________________________________________
2. What are the numbers on the top of the columns? How do you know?
________________________________________________________________________
________________________________________________________________________
________________________________________________________________________
3. What are the minimum and maximum scores obtainable on the SAT?
(Hint: Look at the small print on the bottom left corner of the graph).
________________________________________________________________________
________________________________________________________________________
________________________________________________________________________
________________________________________________________________________
4. Who scored highest on the verbal portion of the test in 1999?
________________________________________________________________________
________________________________________________________________________
5. What is the difference between the total math score in 1967 and 1999?
________________________________________________________________________
________________________________________________________________________
6. Is the combined score for the 1967 and 1999 verbal portion of the test higher for males or females?
________________________________________________________________________
________________________________________________________________________
7. Describe the trend in SAT scores of 1967 to 1999.
________________________________________________________________________
________________________________________________________________________
_______________________________________________________________________
Answer Key for Reading and Interpreting Graphs.
1. Light gray represents the SAT scores for college bound seniors in 1967.
Dark gray represents the SAT scores for college bound seniors in 1999.
2. The numbers are the scores on the SAT test. We can tell they are the scores because of the title of the graph.
3. The minimum and maximum score for the SAT is listed in small black print at the bottom of the graph. The minimum score is 200 and the maximum score is 800.
4. Find the portion of the graph that shows verbal scores. You will notice that there are sections for verbal, total as well as verbal scores for males and females. The score for males is 509 and the score for females is 502.
5. The total math score in 1967 was 492. The total math score in 1999 was 511. To find the difference, you need to subtract 492 from 511.
511- 492 = 19.
6. To find this answer, locate the verbal scores for males in 1967 and 1999. Add together those two scores. (463 + 509 = 972) Then add together the scores the female verbal scores for 1967 and 199. (468 + 502 = 970). The male score is higher than the female score.
7. To determine the trend in scores, compare the light gray bars to the dark gray bars. It is easy to see that the light bars, in every category, are lower than the dark bars. It can be concluded that the scores in all categories of the SAT increased from 1967 to 1999.


