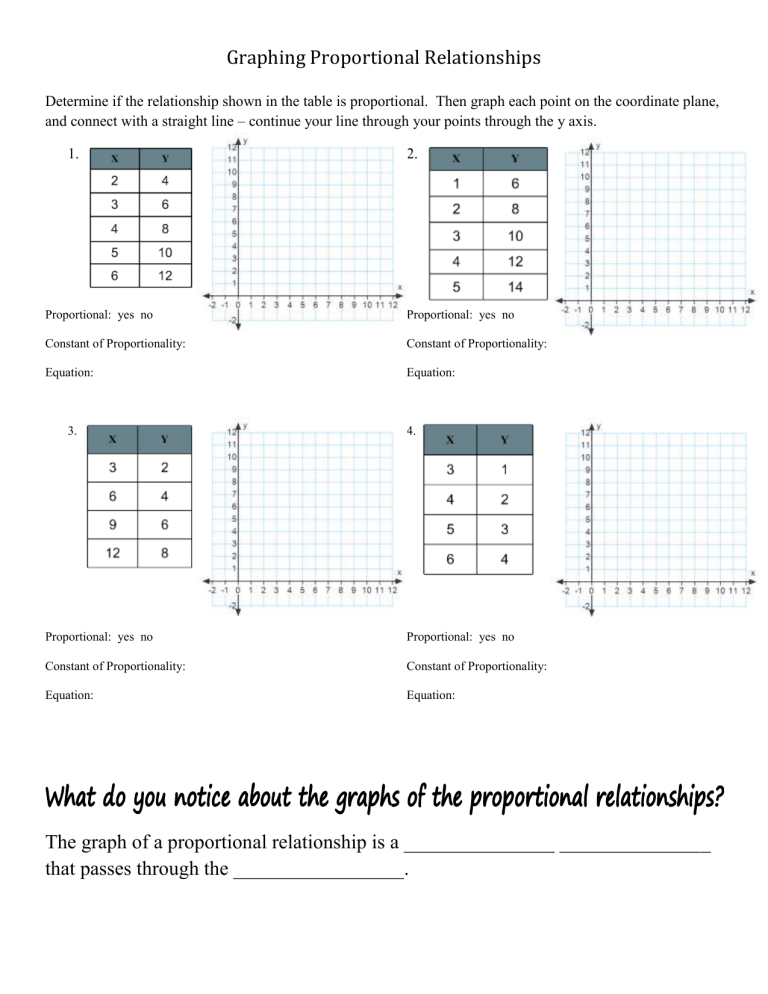
Graphing Proportional Relationships Determine if the relationship shown in the table is proportional. Then graph each point on the coordinate plane, and connect with a straight line – continue your line through your points through the y axis. 1. 2. Proportional: yes no Proportional: yes no Constant of Proportionality: Constant of Proportionality: Equation: Equation: 3. 4. Proportional: yes no Proportional: yes no Constant of Proportionality: Constant of Proportionality: Equation: Equation: The graph of a proportional relationship is a _______________ _______________ that passes through the _________________. Graphing Proportional Relationships 1. The cost of renting video games from Games, Inc. is shown in the table. Determine whether the cost is proportional to the number of games rented by graphing on the coordinate plane. Explain your reasoning. 2. The slowest mammal on the earth is the tree sloth. It moves at a rate of 6 feet per minute. Determine whether the number of feet the sloth moves is proportional to the number of minutes it moves by graphing on the coordinate plane. Explain your reasoning. Identifying the Constant of Proportionality (unit rate) given a graph: The constant of proportionality is always the point ____________, where k is the constant of proportionality. Additionally, you can find the constant of proportionality by finding the ratio of _________ for any point on the ______________________. Let’s try…identify the constant of proportionality in each graph below, and write the equation. 1. 2.


