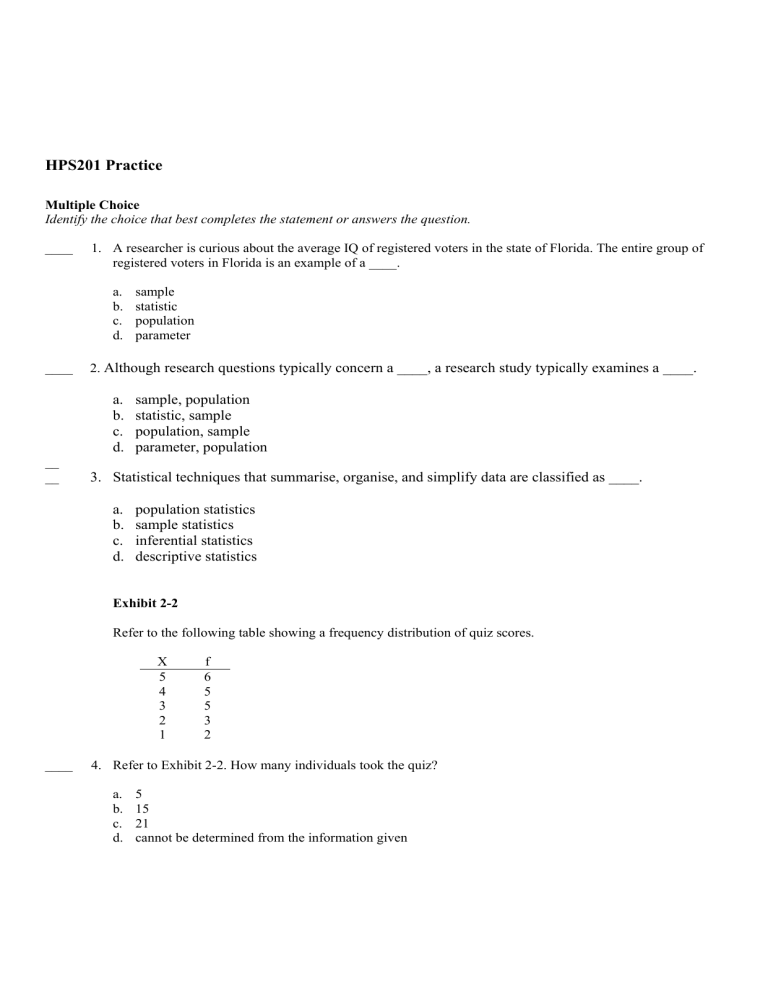
HPS201 Practice Multiple Choice Identify the choice that best completes the statement or answers the question. ____ 1. A researcher is curious about the average IQ of registered voters in the state of Florida. The entire group of registered voters in Florida is an example of a ____. a. b. c. d. ____ 2. Although research questions typically concern a ____, a research study typically examines a ____. a. b. c. d. __ __ sample statistic population parameter sample, population statistic, sample population, sample parameter, population 3. Statistical techniques that summarise, organise, and simplify data are classified as ____. a. b. c. d. population statistics sample statistics inferential statistics descriptive statistics Exhibit 2-2 Refer to the following table showing a frequency distribution of quiz scores. X 5 4 3 2 1 ____ f 6 5 5 3 2 4. Refer to Exhibit 2-2. How many individuals took the quiz? a. b. c. d. 5 15 21 cannot be determined from the information given 5. Refer to Exhibit 2-2. If a score of X = 3 or higher is needed for a passing grade, how many individuals passed? a. b. c. d. ____ 3 11 16 cannot be determined from the information given 6. Refer to Exhibit 2-2. How many individuals had a score of X = 2? a. b. c. d. 1 3 5 cannot be determined from the information given Exhibit 2-5 Refer to the following graph showing a frequency distribution of quiz scores. ____ 7. Refer to Exhibit 2-5. This is an example of a ____ shaped distribution. a. b. c. d. ____ 8. Refer to Exhibit 2-5. How many individual scores are represented in this graph? (What is the value of N?) a. b. c. d. ____ symmetrical positively skewed negatively skewed normal 5 6 13 cannot be determined from the information given 9. Refer to Exhibit 2-5. The lowest score in the class was X = ____ and the number of people with this score is ____. a. b. c. d. 1, 3 1, 1 5, 1 2, 4 ____ 10. What is the value of the median for the following set of scores? Scores: 1, 3, 3, 5, 6, 7, 8, 23 a. b. c. d. 5 5.5 6 54/8 = 7 ____ 11. What is the median for the following set of scores? Scores: 1, 4, 6, 17 a. b. c. d. 4 5 6 7 ____ 12. For any distribution, you can be sure that at least one individual has a score equal to the ____. a. b. c. d. mean median mode All of the other 3 choices are correct. ____ 13. The variability of the scores in a sample tends to be ____ the variability of the scores in the population from which the sample was obtained. a. b. c. d. smaller than larger than exactly the same as unrelated to ____ 14. What is the value of SS (sum of the squared deviations from the mean) for the following sample? Scores: 1, 3, 5 a. b. c. d. 8 8/2 8/3 (8)2 ____ 15. Which set of scores has the least amount of variability? a. b. c. d. 11, 17, 31, 53 5, 11, 42, 22 145, 143, 145, 147 27, 105, 10, 80 ____ 16. Of the following z-score values, which one represents the most extreme location on the left-hand side of the distribution? a. b. c. d. z = +1.00 z = +2.00 z = -1.00 z = -2.00 _____17. For a population with = 10, a score that is located 20 points above the mean would have a z-score of ____. a. b. c. d. +20 +2 -2 cannot answer without knowing the mean ______18. Suppose you earned a score of X = 54 on an exam. Which set of parameters would give you the highest grade? a. b. c. d. = 50 and = 2 = 50 and = 8 = 58 and = 2 = 58 and = 8 ____ 19. On an exam with = 52, you have a score of X = 48. Which value for the standard deviation would give you a higher position in the class distribution? a. b. c. d. =1 =2 =4 cannot determine from the information given ____ 20. Last week, Bob had a score of X = 45 on a mathematics exam and a score of X = 61 on an English exam. If the math exam scores had a mean of = 40 with = 5, and the English exam scores had a mean of = 51 with = 10, for which exam should Bob expect the better grade? a. mathematics b. English c. The two exam scores are in equivalent locations so Bob should expect the same grade in both classes. d. cannot answer without additional information ____ 21. If random samples, each with n = 4 scores, are selected from a normal population with = 80 and = 10, then the distribution of sample means will have a standard error of ____. a. 4 b. 5 c. 10 d. 80 ____ 22. A researcher risks a Type I error ____. a. b. c. d. anytime H0 is rejected anytime H1 is rejected anytime the decision is "fail to reject H0" All of the other options are correct. ____ 23. In a hypothesis test, an extreme, low-probability value for the z-score is an indication that ____. a. b. c. d. the null hypothesis is probably correct the null hypothesis is probably wrong the null hypothesis is certainly correct the null hypothesis is certainly wrong ____ 24. A researcher expects a treatment to produce an increase in the population mean. Assuming a normal distribution, what is the critical z-score for a one-tailed test with = .01? a. b. c. d. +2.33 2.58 +1.65 2.33 ____ 25. A researcher reports that there is a significant difference between two treatments at the .05 level of significance. This means that ____. a. if the researcher repeated the experiment, there is a 95% probability that the same decision would be reached b. the difference obtained in the experiment is at least 5% larger than the standard error c. there is a 5% probability (or less) that the difference occurred simply by chance without any treatment effect d. the average score for one treatment is at least 5% higher than the average score for the other treatment ____ 26. A researcher is conducting a chi-square test for goodness of fit to evaluate preferences among three different designs for a new automobile. With = .05 and a sample of n = 30 the researcher obtains a chi-square statistic of 2 = 4.81. What is the appropriate statistical decision for this outcome? a. b. c. d. Reject the null hypothesis with = .05 but not with = .01. Reject the null hypothesis with either = .05 or = .01. Fail to reject the null hypothesis with either = .05 or = .01. There is not enough information to determine the appropriate decision. ____ 27. A chi-square test for independence is used to evaluate the relationship between two variables. If one variable is classified into 4 categories and the other variable is classified into 2 categories, then the chi-square statistic will have a. b. c. d. df = 3 df = 6 df = 8 cannot determine the value of df from the information provided ____ 28. A researcher is examining the relationship between color preferences and gender. A sample of 30 men and 30 women is obtained and each person is asked to identify his/her preference between two choices of paint colors for a new student lounge. For this sample, 5 of the men preferred color A, and 15 of the women preferred color A. If a chi-square test is used to evaluate the relationship, what is the expected frequency for men preferring color A? a. b. c. d. 5 10 15 20 ____ 29. The data from an independent-measures research study produce a sample mean difference of four points and a pooled variance of 12. If there are n = 6 scores in each sample, then the value for the t statistic is ____. a. 1 b. 2 c. 4/ d. 4/ ____ 30. An independent-measures research study produces a t statistic with df = 20. What is the total number of individuals who participated in the study? a. b. c. d. 18 19 21 22 ____ 31. For which of the following situations would a repeated-measures study be appropriate? a. Compare attitude scores for males versus females. b. Compare personality scores for individuals diagnosed with an eating disorder and those who are not diagnosed. c. Compare salary levels for college graduates and those who did not graduate from college. d. Compare reaction times before and after taking a pain medication. ____ 32. A researcher conducts a research study comparing two treatment conditions and obtains 20 scores in each treatment. If the researcher used a repeated-measures design, then how many subjects participated in the research study? a. b. c. d. 10 20 21 40 ____ 33. A repeated-measures study produced a t statistic with df = 20. How many individuals participated in the study? a. b. c. d. 19 21 22 41 ____ 34. A scatter plot shows a set of data points that are widely scattered around a line that slopes up to the right. Which of the following values would be closest to the correlation for these data? a. b. c. d. 0.80 0.40 -0.40 -0.80 ____ 35. For these data, the Pearson correlation ___. X 2 5 3 2 a. b. c. d. Y 4 2 5 5 is positive is negative is zero cannot be determined ____ 36. Which of the following sets of correlations correctly shows the highest to lowest degree of relationship? a. b. c. d. -0.91, +0.83, +0.10, -0.03 -0.91, +0.83, -0.03, -0.10 +0.83, +0.10, -0.91, -0.03 +0.83, +0.10, -0.03, -0.91 ____ 37. As the sample size gets larger, the size of the correlation necessary for significance a. b. c. d. also gets larger gets smaller stays constant There is no consistent relationship between sample size and the critical value for a significant correlation. ____ 38. An independent-measures research study compares three treatment conditions using a sample of n = 5 in each treatment. For this study, the three sample totals are, T1 = 5, T2 = 10, and T3 = 15. What value would be obtained for SStreatment? a. b. c. d. 1 5 10 15 ____ 39. A researcher uses an analysis of variance to test for mean differences among three treatment conditions using a sample of n = 10 subjects in each treatment. The F-ratio from this analysis would have a. b. c. d. df = 29 df = 2, 29 df = 3, 27 df = 2, 27 ____ 40. A treatment effect refers to differences between scores that are caused by the different treatment conditions. The differences (or variability) produced by treatment effects will contribute to ____. a. b. c. d. the numerator of the F-ratio the denominator of the F-ratio both the numerator and the denominator of the F-ratio Treatment effects do not contribute to the F-ratio because they are removed before the Fratio is computed. ____ 41. How many separate samples would be needed for a two-factor, independent-measures research study with 2 levels of factor A and 3 levels of factor B? a. b. c. d. 2 3 5 6 ____ 42. A "two-factor" experimental study, means that the study has ____. a. b. c. d. two independent variables two dependent variables exactly two groups of participants an interaction between two variables ____ 43. In a line graph showing the results from a two-factor experiment, the levels of factor B are presented on the X-axis and the line for A1 is consistently 5 points higher than the line for A2. What result is indicated by this pattern? a. b. c. d. no indication of an interaction an indication of an overall A-effect an indication of an A-effect but no indication of an interaction an indication of an interaction but no indication of an A-effect For the following questions you will need to read the study design and refer to the SPSS output provided. A researcher was interested in examining the relationship between levels of self-esteem and drug use problems in a non-clinical sample. Specifically, the researcher sought to determine whether people classified as ‘low self-esteem’ would report significantly higher levels of drug-related problems compared to the ‘high self-esteem group’. The SPSS output from the analysis is presented below Independent Samples Test Levene's Test for Equality of Variances F Drug Use Equal variances Problems Score assumed Equal variances not assumed .868 Sig. .354 t-test for Equality of Means t Mean Sig. (2-tailed) Difference df Std. Error Difference 4.272 98 .000 1.94000 .45411 1.03884 2.84116 4.272 97.933 .000 1.94000 .45411 1.03883 2.84117 44. What analysis has been utilised here? a. b. c. d. One-Way ANOVA One-sample t-test Independent samples t-test Matched-samples t-tests 45. Which of the following is the correct interpretation of the homogeneity of variance test? a. b. c. d. The homogeneity of variance assumption was violated, F = 0.87, p < 0.05. The homogeneity of variance assumption was not violated, t(98) = 4.272, p > 0.05. The homogeneity of variance assumption was not violated, F = 0.87, p > 0.05. The homogeneity of variance assumption was not violated, F = 0.87, p < 0.05. 46. How many participants were in this study? a. b. c. d. 95% Confidence Interval of the Difference Lower Upper 50 100 98 Cannot be determined from the information provided. 47. What can you conclude on the basis of these results? a. Reject the null hypothesis and conclude that there is no significant difference between the two groups b. Fail to reject the null hypothesis and conclude that there is no significant difference between the two groups c. Fail to reject the null hypothesis and conclude that there is a significant difference between the two groups d. Reject the null hypothesis and conclude that there is a significant difference between the two groups 48. Which of the following is the correct way to report the results of the t-test? a. b. c. d. t(98) = 4.27, p < 0.05 t(97.9) = 4.27, p < 0.05 t(98) = 4.27, p > 0.05 t(97.9) = 4.27, p > 0.05

