BUS 220 chapter 3 assignment
advertisement

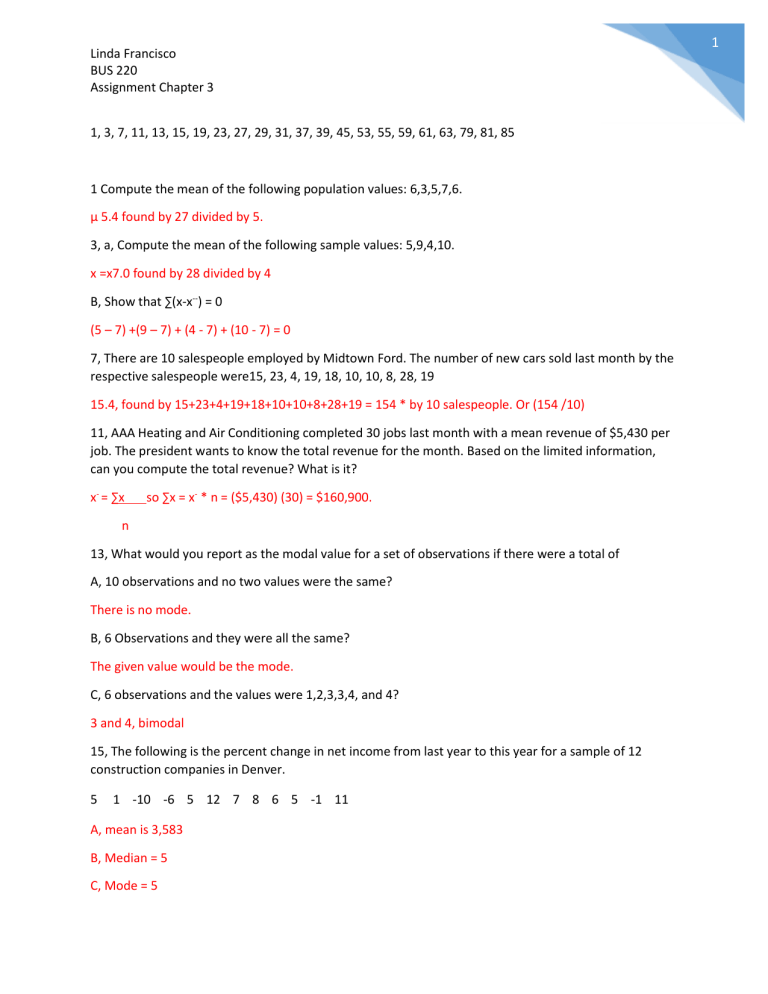
Linda Francisco BUS 220 Assignment Chapter 3 1, 3, 7, 11, 13, 15, 19, 23, 27, 29, 31, 37, 39, 45, 53, 55, 59, 61, 63, 79, 81, 85 1 Compute the mean of the following population values: 6,3,5,7,6. µ 5.4 found by 27 divided by 5. 3, a, Compute the mean of the following sample values: 5,9,4,10. x =x7.0 found by 28 divided by 4 B, Show that ∑(x-x--) = 0 (5 – 7) +(9 – 7) + (4 - 7) + (10 - 7) = 0 7, There are 10 salespeople employed by Midtown Ford. The number of new cars sold last month by the respective salespeople were15, 23, 4, 19, 18, 10, 10, 8, 28, 19 15.4, found by 15+23+4+19+18+10+10+8+28+19 = 154 * by 10 salespeople. Or (154 /10) 11, AAA Heating and Air Conditioning completed 30 jobs last month with a mean revenue of $5,430 per job. The president wants to know the total revenue for the month. Based on the limited information, can you compute the total revenue? What is it? x- = ∑x so ∑x = x- * n = ($5,430) (30) = $160,900. n 13, What would you report as the modal value for a set of observations if there were a total of A, 10 observations and no two values were the same? There is no mode. B, 6 Observations and they were all the same? The given value would be the mode. C, 6 observations and the values were 1,2,3,3,4, and 4? 3 and 4, bimodal 15, The following is the percent change in net income from last year to this year for a sample of 12 construction companies in Denver. 5 1 -10 -6 5 12 7 8 6 5 -1 11 A, mean is 3,583 B, Median = 5 C, Mode = 5 1 2 Linda Francisco BUS 220 Assignment Chapter 3 19, The accounting firm of Rowatti and Koppel specializes in income tax returns for self-employed professionals, such as physicians’ dentists, architects, and lawyers. The firm employs 11 accountants who prepare the returns. For last year, the number of returns prepared by each accountant was: 58 75 31 58 46 65 60 71 45 58 80 A, x- = 647 = 58.82, mean is 58 and mode is 58. 11 23, In June, an investor purchased 300 shares of Oracle (an information technology company) stock at $20 per share. In August, she purchased an additional 400 shares at $25 per share. In November, she purchased an additional 400 shares, but the stock declined to $23 per share. What is the weighted mean price per share? $22.91, found by 300($20) + 400($25) + 400(23) 300 + 400 + 400 27, Compute the geometric mean of the following percent increases: 8, 12, 14, 26, and 5. 12.8%, found by √5------------------------------------------------------------------- = 1.128 (1.08)(1.12)(1.14)(1.26)(1.05) 29, Listed below is the percent increase in sales for the MG Corporation over the last 5 years. Determine the geometric mean percent increase in sales over the period. 9.4 13.8 11.7 11.9 14.7 12.28%, increase found by √5--------------------------------------------------------------------------------------(1.094)(1.138)(1.117)(1.119)(1.147 = 1.1228 31, The Consumer Prices Index is reported monthly by the US Bureau of Labor Statistics. It reports the change in prices for a market basket of goods from one period to another. The Index for 2000 was 172.2 By 2012, It increased to 229.6. What was the geometric mean annual increase for the period? 2.43%, found by √12--------------229.6 - 1 172.2 3 Linda Francisco BUS 220 Assignment Chapter 3 37, Dave’s Automatic Door installs automatic garage door openers. The following list indicates the number of minutes needed to install 10 door openers:28, 32, 24, 46, 44, 40, 54,38, 32, and 42. A, 30, found by 54 – 24 B,38, found by 380/10 C, 74.4, found by 744/10 D, The difference between 54 and 24 is 30. The average of the squared deviations from 38 is 74.4. 39, Ten young adults living in California rated the taste of a newly developed sushi pizza topped with tuna, rice and kelp on a scale of 1 to 50, with 1 indication they did not like the taste and 50 that they did. The rating were 34 39 40 46 33 31 34 14 15 45 In a parallel study, 10 young adults in Iowa rated the taste of the same pizza. The ratings were 28 25 35 16 25 29 24 26 17 17 20 Safe Mean Median Range California 33.1 34 32 Iowa 24.5 25 19 The mean and median ratings were higher, but there was also more variation in California. 45, Plywood Inc. reported these returns on stockholder equity for the past 5 years: 4.3 4.9 7.2 6.7 and 11.6. Consider these as population values. A, Compute the range, the arithmetic mean, the variance, and the standard deviation. Ranger: 7.3 found by 11.5 – 4.3. Arithmetic mean: 6.94, found by 34.7/5. Variance: 6,5944, found by 32.972/5. Standard deviation: 2,568, found by √-------------- - 6.5944. B, Compare the return on stockholder equity for plywood Inc. with that for Dennis Industries cited in exercise 44. Linda Francisco BUS 220 Assignment Chapter 3 Dennis has a higher mean return (11.76 > 6.94) However, Dennis has greater spread in its returns on equity (16.89 > 6.59) 53, According to Chebyshev’s theorem, at least what percent of any set of observations will be within 1.8 standard deviations of the mean? About 69%, found by 1 - 1 /(1.8)2 55, The distribution of the weights of a sample of 1,400 cargo containers is symmetric and bell- shaped. According to the Empirical Rule, what percent of the weights will lie A, Between x- - 2s and x- + 2s? About 95% B, Between x- and x- + 2s and x- -2s? 47.5%, 2.5% 59, Estimate the mean and the standard deviation of the following frequency distribution. Class 20 up to 30 30 up to 40 40 up to 50 50 up to 60 60 up to 70 Class 20 up to 30 30 up to 40 40 up to 50 50 up to 60 60 up to 70 Frequency 7 12 21 18 12 f x- = 3,310 = 47.29, 70 m 7 12 21 18 12 70 s= fm 25 35 45 55 65 175 420 945 990 780 3,310 (m-x) f(m-x)2 -22.29 3,477.91 -12.29 1,812.53 -2.29 110.126 7.71 1,069.99 17.71 3,763.73 10,234.29 √-----------------10,234.287 = 12.18 70 - 1 61, The IRS was interested in the number of individual tax forms prepared by small accounting firms. The IRS randomly sampled 50 public accounting firms with 10 or fewer employees in the Dallas – Fort Worth area. The following frequency table reports the results of the study. 4 5 Linda Francisco BUS 220 Assignment Chapter 3 Estimate the mean and the standard deviation. Number of clients 20 up to 30 30 up to 40 40 up to 50 50 up to 60 60 up to 70 Class 20 up to 30 30 up to 40 40 up to 50 50 up to 60 60 up to 70 Frequency 1 15 22 8 4 f m 1 15 22 8 4 50 x-- = 2240 = 44.8, 50 fm 25 35 45 55 65 25 525 990 440 260 2,240 (m-x) f(m-x)2 -19.8 392.04 -9.8 1,440.60 0.2 0.88 10.2 832.32 20.2 1,632.16 4,298.00 s = √4298 = 9.37 50 - 1 63, The accounting firm of Crawford and Associates has five senior partners. Yesterday the senior partners saw six, four, three, seven, and five clients, respectively. A, Compute the mean and median number of clients seen by the partners. Mean = 5, found by rearranging the values and selecting the middle value. B, Is the mean a sample mean or a population mean? Population, because all partners were included. C, Verify that ∑ (x - µ) = 0. ∑ (x - µ) = (6 – 5) + (4 – 5) + (3 – 5) + (7 – 5) + (5 – 5) = 0 79, The Apollo space program lasted from 1967 until 1972 and included 13 missions. The missions lasted from as little as hours to as long as 301 hours. The duration of each flight is listed below. 9 10 195 295 241 142 301 216 260 7 244 192 A, Explain why the flight times are a population. There were 13 flight, so all items are considered. B, Find the mean and median of the flight times. µ = 2259 = 173.77 Median = 195 13 147 6 Linda Francisco BUS 220 Assignment Chapter 3 C, Find the range and the standard deviation of the flight times. Range = 301 – 7 = 294 S = √-------------------133.846 = 101.47 13 81, A sample of 25 undergraduates reported the following dollar amounts of entertainment expenses last year: 684 763 710 681 688 731 711 736 722 771 698 693 723 701 743 737 738 717 722 752 A, Find the mean, median, and mode of this information. The mean is $717.20, found by $17,930/25. The median is $717.00 and there are two lodes, $710 and $722. B, What are the range and standard deviation? The range is $90, found by the square root of 14850/24. C, Use the Empirical Rule to establish an interval that includes about 95% of the observations. From $667.46 up to $766.94, found by $717.20 ± 2($24.87) 85, Bidwell Electronics Inc. recently surveyed a sample of employees to determine how far they lived from corporate headquarters. The results are shown below. Compute the mean and the standard deviation. Distance(miles) 20 up to 30 30 up to 40 40 up to 50 50 up to 60 60 up to 70 x-- = 13 = 910 70 Frequency 4 15 27 18 6 M 2.5 7.5 12.5 17.5 22.5 S = 5228 = √1807.5/69 696 721 685 710 697


