Statistics Exam 1
advertisement

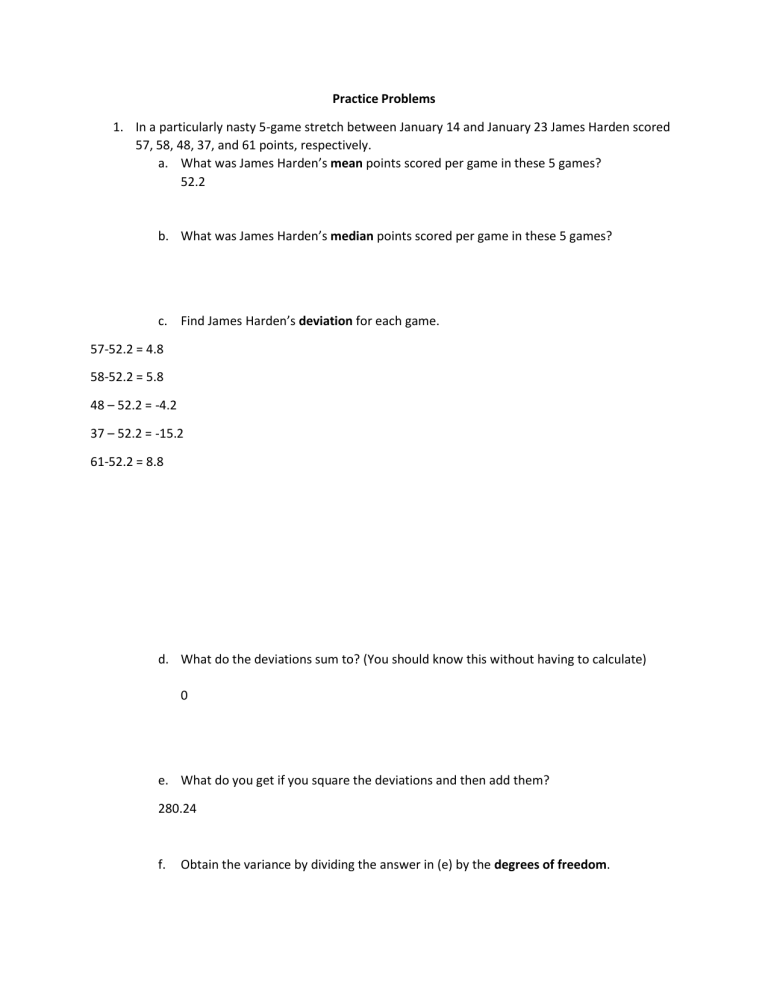
Practice Problems 1. In a particularly nasty 5-game stretch between January 14 and January 23 James Harden scored 57, 58, 48, 37, and 61 points, respectively. a. What was James Harden’s mean points scored per game in these 5 games? 52.2 b. What was James Harden’s median points scored per game in these 5 games? c. Find James Harden’s deviation for each game. 57-52.2 = 4.8 58-52.2 = 5.8 48 – 52.2 = -4.2 37 – 52.2 = -15.2 61-52.2 = 8.8 d. What do the deviations sum to? (You should know this without having to calculate) 0 e. What do you get if you square the deviations and then add them? 280.24 f. Obtain the variance by dividing the answer in (e) by the degrees of freedom. g. Obtain the standard deviation from your answer in part (f). 2. Suppose that someone categorizes the number of points score by James Harden as follows: less than 20, ≤ 20 𝑎𝑛𝑑 < 30, ≤ 30 𝑎𝑛𝑑 < 40, ≤ 40 𝑎𝑛𝑑 < 50, and equal or more than 50. a. What kind of variable is this? b. Suppose the frequency table listed these variables in following order: Category Frequency Relative Frequency Cumulative Frequency 50 or More Less than 20 Between 40 and 50 Between 30 and 40 Between 20 and 30 Would the cumulative frequency for ‘Between 40 and 50’ be an accurate description of the number of games in which James Harden scored ‘Between 40 and 50’ or less? c. Reorder the categories into something interpretable. Then use the fact that in the first 50 games of the season James Harden had 3 games with less than 20 points, 10 games with equal or more than 20 but less than 30 points, 16 games with equal or more than 30 points but less than 40 points, 13 games with equal or more than 40 points but less than 50 points, and 5 games with 50 or more points. Category Frequency Relative Frequency Cumulative Frequency d. Did the frequencies sum to 50 games? Did the relative frequencies sum to 100%? What do you think happened? e. In what percentage of games did James Harden score less than 40 points? 3. In the first 50 games of the season, James Harden averaged 36.34 points per game. The median number of points scored was 36. a. Based on these statistics, do you think that the distribution of points score is symmetric or skewed? b. The variance for James Harden’s scoring is 107.79. Find the standard deviation. What are the units for the variance? What are the units for the standard deviation? Which is more interpretable? c. State the Normal Rule, being sure to include the assumptions. d. Do you think the Normal Rule is approximately applicable in this case? Why? e. If the Normal Rule is applicable, then apply the Normal Rule to James Harden’s scoring through 50 games using the information above. 4. Suppose that the same referee has been overseeing all the Rockets’ games. This referee has traveled from the past, before the advent of the 3-point line, and therefore refuses to acknowledge that baskets made from inside the 3-point line are worth 2 points, and those made outside the 3-point line are worth 3 points (that is, under this referee every shot made is worth 2 points). What kind(s) of measurement inaccuracy, if any, occur in this situation? 5. Download the file ‘JH.xlsx’ from Module 4 in Canvas. Use JMP to do the following: a. Verify that the mean, median, variance, and standard deviation are correct. b. Verify the number of games James Harden played in, and verify the number he did not play in. c. Obtain a histogram for the raw values of points scored, being sure to include all relevant axes (use Histogram Options to add ‘Count Axis’). d. Use value ordering to reorder the ‘levels’ or ‘categories’ into the correct order so that he JMP output matches the order you decided upon in #2 (c). e. Add cumulative frequency to frequency table. f. Obtain the barchart for ‘JH points categories’, being sure to: i. Separate the bars (use Histogram Options). ii. Place relative frequency on the Y-axis (Use Histogram Options). iii. Put frequency on the bars (Use Histogram Options). iv. Copy and paste (or use the snipping tool) to put the plot into a separate document. Make sure all axes are included.

