homeostasis-worksheet
advertisement

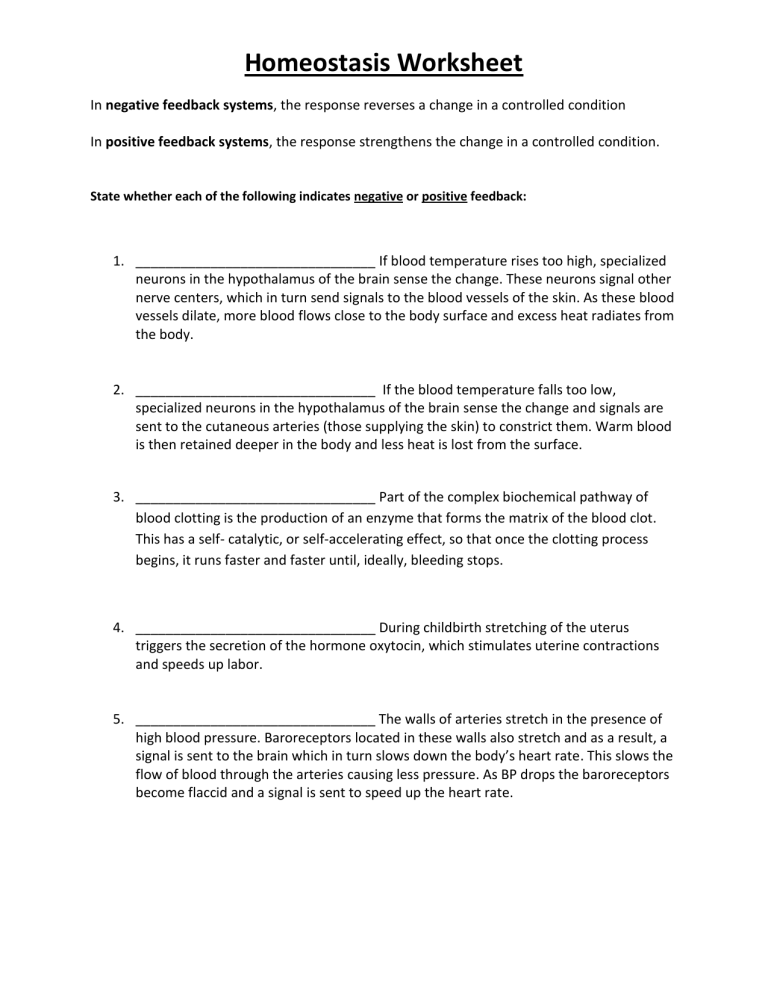
Homeostasis Worksheet In negative feedback systems, the response reverses a change in a controlled condition In positive feedback systems, the response strengthens the change in a controlled condition. State whether each of the following indicates negative or positive feedback: 1. ________________________________ If blood temperature rises too high, specialized neurons in the hypothalamus of the brain sense the change. These neurons signal other nerve centers, which in turn send signals to the blood vessels of the skin. As these blood vessels dilate, more blood flows close to the body surface and excess heat radiates from the body. 2. ________________________________ If the blood temperature falls too low, specialized neurons in the hypothalamus of the brain sense the change and signals are sent to the cutaneous arteries (those supplying the skin) to constrict them. Warm blood is then retained deeper in the body and less heat is lost from the surface. 3. ________________________________ Part of the complex biochemical pathway of blood clotting is the production of an enzyme that forms the matrix of the blood clot. This has a self- catalytic, or self-accelerating effect, so that once the clotting process begins, it runs faster and faster until, ideally, bleeding stops. 4. ________________________________ During childbirth stretching of the uterus triggers the secretion of the hormone oxytocin, which stimulates uterine contractions and speeds up labor. 5. ________________________________ The walls of arteries stretch in the presence of high blood pressure. Baroreceptors located in these walls also stretch and as a result, a signal is sent to the brain which in turn slows down the body’s heart rate. This slows the flow of blood through the arteries causing less pressure. As BP drops the baroreceptors become flaccid and a signal is sent to speed up the heart rate. Homeostasis Worksheet Always graph time on the horizontal (X) axis. Label your axes Problem 1: A patient’s body temperature was recorded over a 24-hour period; the temperature at each hour is listed in the table below. Graph the data in the space provided and state whether it indicates negative or positive feedback. TIME 12 am 3 am 6 am 9 am 12 pm 3 pm 6 pm 9 pm TEMP, °F 98.30 98.10 98.40 98.90 98.70 98.50 98.60 98.80 TYPE OF FEEDBACK _________________________________________________ Problem 2: A man with heart disease has his blood pressure monitored closely. TIME 7 am 8 am 9 am 10 am 11 am 12 noon 1 pm BP mm Hg 200 190 170 150 130 110 70 TYPE OF FEEDBACK _________________________________________________ Homeostasis Worksheet Recognize normal parameters: The normal range for blood glucose is 70-110 m/dl The normal range for blood pH is 7.35-7.45 Problem 3: A woman is being tested for diabetes mellitus. Her blood glucose is measured over a period of time. TIME 0 1 hour later 2 hours later 3 hours later 4 hours later 5 hours later Blood Glucose m/dl 100 120 110 90 80 85 TYPE OF FEEDBACK ______________________________________________ Does the patient always remain within the normal range _________________ Does the patient have any apparent problems with glucose regulation? _______________ Problem 4: A man with kidney problems is being watched for acid base imbalance. TIME 7 am 9 am 12 pm 1 pm 6 pm 8 pm 10 pm 12 am 3 am pH 7.45 7.46 7.44 7.42 7.39 7.37 7.38 7.40 7.42 TYPE OF FEEDBACK ______________________________________________ Does the patient always remain within the normal range _________________ Does the patient have any apparent problems with acid base balance? _______________

