Demand & Supply Practice Worksheet
advertisement

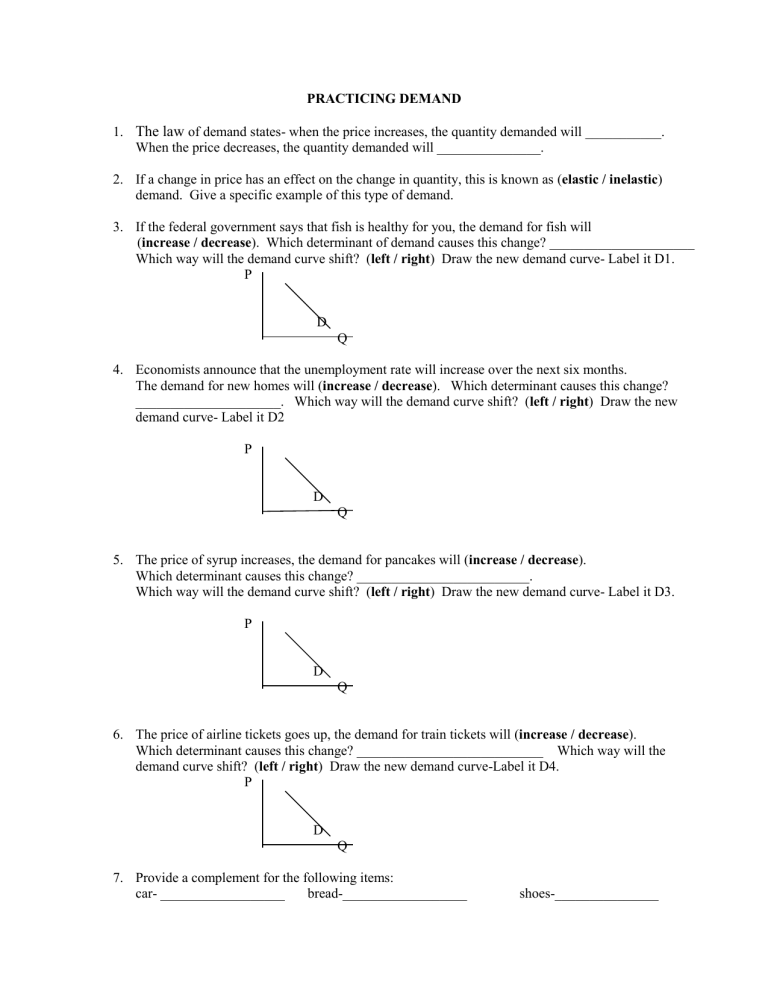
PRACTICING DEMAND 1. The law of demand states- when the price increases, the quantity demanded will ___________. When the price decreases, the quantity demanded will _______________. 2. If a change in price has an effect on the change in quantity, this is known as (elastic / inelastic) demand. Give a specific example of this type of demand. 3. If the federal government says that fish is healthy for you, the demand for fish will (increase / decrease). Which determinant of demand causes this change? _____________________ Which way will the demand curve shift? (left / right) Draw the new demand curve- Label it D1. P D Q 4. Economists announce that the unemployment rate will increase over the next six months. The demand for new homes will (increase / decrease). Which determinant causes this change? _____________________. Which way will the demand curve shift? (left / right) Draw the new demand curve- Label it D2 P D Q 5. The price of syrup increases, the demand for pancakes will (increase / decrease). Which determinant causes this change? _________________________. Which way will the demand curve shift? (left / right) Draw the new demand curve- Label it D3. P D Q 6. The price of airline tickets goes up, the demand for train tickets will (increase / decrease). Which determinant causes this change? ___________________________ Which way will the demand curve shift? (left / right) Draw the new demand curve-Label it D4. P D Q 7. Provide a complement for the following items: car- __________________ bread-__________________ shoes-_______________ 8. Provide a substitute for the following items: car-___________________ pen-____________________ television-____________ 9. Plot the points for the demand curve and label the line D1. Demand Schedule #1 Price Quantity $9.00 1 $6.00 3 $5.00 4 $2.00 6 $1.00 7 P Q Demand Schedule #2 Price Quantity $9.00 3 $8.00 4 $5.00 6 $4.00 7 $1.00 9 Use the graph above, plot the points for the new demand curve and label it D2 10. Does a shift from D1 to D2 reflect an increase or a decrease in demand? _________________ Identifying the determinants of demand. You have seen have how an increase in demand is depicted on a graph by a shift in the demand curve. • When the demand curve shifts upward and to the right, this is indicative of an increase in demand. • When the demand curve shifts to the left, this is indicative of a decrease in demand. • Factors that result in a change in demand are the determinants of demand. Complete the table below. For each determinant of demand: • indicate whether demand will increase or decrease; • provide an explanation as to why. Determinant of demand Population increases Population decreases Increase in most peoples’ income Decrease in most peoples’ income Price of substitute increases Price of substitute decreases Price of complementary good increases Price of complimentary good decreases Product becomes a popular fad (change in taste of buyers) Product now out of fashion (change in taste of buyers) There is an expectation that the price of the product will soon fall There is a fear that the economy will go into a recession where many firms will fail and unemployment will increase Demand increases or decreases? Explanation Movement along the curve or a shift in the demand curve? Complete the table below by indicating whether each scenario results in a change in the quantity demanded (movement along the demand curve), or a change in demand (shift in the demand curve). If there is a shift in the demand curve, indicate whether the curve shifts up or down. Scenario 1. There is an outbreak of the flu and sales of latex gloves skyrocket. 2. A nail salon cuts the price it charges for manicures and more clients come. 3. A chain of department stores extends the hours that stores will remain open and total sales for the chain has increased. 4. The US Census Bureau has announced that there is baby boom in the United States and sales of baby carriages have increased. 5. John’s Bicycle shop increases the prices of bicycles and sales decrease. 6. The City of New York has cut the number of city employees by 10% and sales of big screen televisions falls. Movement or shift up or shift down? PRACTICING WITH ELASTICITY Using Total Revenue Test For each problem, complete the mathematics, fill in the answer blanks and circle the correct answer (↓ or ↑) for “Price” and “Total Revenue”. Then, calculate the elasticity and write whether the product is price elastic or price inelastic (between the two prices). 1. Price rises from $5 to $6. Quantity demanded decreases from 15 to 10. a. Old price x quantity demanded = old revenue ___________ _________ _________ b. New price x quantity demanded = new revenue _________ ___________ c. Price ↓ ↑ Total Revenue ↓ ↑ _________ d. Elasticity = _______________________ e. The good is: ELASTIC or INELASTIC 2. Price falls from $20 to $15. Quantity demanded increases from 1,000 to 1,500. a. Old price x quantity demanded = old revenue ___________ _________ _________ b. New price x quantity demanded = new revenue _________ ___________ c. Price ↓ ↑ Total Revenue ↓ ↑ _________ d. Elasticity = _______________________ e. The good is: ELASTIC or INELASTIC 3. Price rises from $2.10 to $2.50. Quantity demanded decreases from 1,100 to 1,000. a. Old price x quantity demanded = old revenue ___________ _________ _________ b. New price x quantity demanded = new revenue _________ ___________ c. Price ↓ ↑ Total Revenue ↓ ↑ _________ d. Elasticity = _______________________ e. The good is: ELASTIC or INELASTIC 4. Price falls from $4 to $3. Quantity demanded increases from 1,100 to 1,500. a. Old price x quantity demanded = old revenue ___________ _________ _________ b. New price x quantity demanded = new revenue _________ ___________ c. Price ↓ ↑ Total Revenue ↓ ↑ _________ d. Elasticity = _______________________ e. The good is: ELASTIC or INELASTIC 5. The figure shows the demand curve for popsicles. Is the elasticity of demand when the price of a popsicle increases from $0.30 to $0.50 elastic or inelastic? ________________________________ In Your Words: 6. Why do price and total revenue go in opposite directions when the demand for the good is elastic? 7. Why do price and total revenue go in the same direction when the demand for the product is inelastic? Using Percent Change 8. Dan sells newspapers. Dan says that a 10 percent increase in the price of a newspaper will decrease the quantity of newspapers demanded by 8 percent. Is the demand for newspapers elastic, inelastic, or unit elastic? ____________________________________ 9. A video store owner noticed a 5% drop in rentals of DVDs after raising her prices 10%. Are DVD rentals elastic, inelastic, or unit elastic? ____________________________________ PRACTICING SUPPLY Create a supply curve The survey to assess students’ willingness to work at the library was distributed to all seniors in the school; the total hours that students are willing to work at the different hourly rates are presented in the supply schedule for part time workers below: Supply Schedule for Part Time Workers Hourly rate # hours seniors are willing to work $30 1500 $25 1440 $20 1380 $15 1100 $10 840 $7 480 $5 240 $3 0 $2 0 $1 0 Using the data in the supply schedule for part time workers, draw the supply curve. Supply of Part Time Workers $30 $25 Hourly rate $20 $15 $10 $7 $5 $3 $0 200 400 600 800 1000 1200 1400 1600 1800 2000 Quantity of Part Time Workers Supplied In your own words, summarize the information displayed in the graph: 2200 2400 2600 Changes in Supply – A Shift in the Supply Curve The supply schedule below presents the results of a survey of seniors only, and seniors and juniors, indicating the number of hours these students would be willing to work in the school library at different hourly rates of pay. Hourly rate $30 $25 $20 $15 $10 $7 $5 $3 $2 $1 Supply Schedule of Student Workers’ Hours # hours juniors are # hours seniors are # hours juniors and willing to work (S1) willing to work (S2) seniors are willing to work (S3) 1125 1500 2625 1080 1440 2520 1035 1380 2415 825 1100 1925 630 840 1470 360 480 840 180 240 420 0 0 0 0 0 0 0 0 0 Exercise 1: Using the data from the supply schedule for part time workers, draw supply curves S2 and S3 on the graph below. Supply of Part Time Workers 35 30 Hourly Rates 25 20 15 10 5 0 0 500 1000 1500 2000 Quantity of Part Time Hours 2500 3000 Refer to the chart you have drawn and answer the following questions: 1. When the hourly rate is $20, compare the quantity of hours students are willing to work at supply levels S2 and S3. 2. When supply increases at all price levels, the supply curve shifts in which direction: right or left? Exercise 2: In the table below, complete the following: 1. Record the effect on supply. 2. In each instance, state if the supply curve shifts right or left. 3. In your own words provide an explanation of the suppliers’ reactions. Determinant of supply A decrease in the price of inputs. A change in the price of inputs (raw materials, wages, etc.) An increase in the price of inputs. Increase in the number of firms in the industry A change in the number of firms in the industry. Decrease in the number of firms Increase in taxes A change in taxes Decrease in taxes New technology Technology development Effect on supply Graph goes Right or Left? Explanation Use the following information to make a graph of the supply curve and then use that information to adjust the curve the directions needed with the following scenarios. Be sure to do each scenario in a different color and use a key or labels. PRICE $20 $10 7500 15000 QUANTITY PRICE QTY OF PEACHES $2.50 1000 $5.00 2250 $7.50 4000 $10.00 6000 $12.50 8750 $15.00 10000 $17.50 12500 $20.00 15000 1. How does the graph show us the “law of supply?” 2. IF THE COST OF PRODUCING ONE SINGLE PEACH IS $1.50, what is the profit made at each of the below prices? PRICE $2.50 $5.00 $7.50 $10.00 $12.50 $15.00 $17.50 $20.00 PROFIT MADE 3. If peach farmers choose to start growing apples due to a new government incentive plan, how would that affect the supply curve? Draw a new supply line in a different color or with a new label and EXPLAIN WHY IT MOVES THIS WAY. 4. If a new chemical allows trees to produce more peaches on every tree, how would that affect the supply curve? Draw a new supply line in a different color or with a new label and EXPLAIN WHY IT MOVES THIS WAY. 5. If the government enforces a new excise tax on peaches, how would that affect the demand curve? Draw a new supply line in a different color or with a new label and EXPLAIN WHY IT MOVES THIS WAY. For each problem, answer the question then illustrate the change that will occur on the graph below. First draw the original supply line and label it “S”. Then draw the new supply line and label it “S1”. 1. Sony purchases new technology that will allow more Playstation 3s to be produced each hour. This will ______________________ supply. P Q 2. Company B attempts to increase profits by raising prices. How will this change the supply curve? P Q 3. Droughts in the Midwest cause food prices to soar. This will cause Richardmart to ____________________ its supply of grocery products. P Q 4. The government places strict pollution regulations on automotive producers in Detroit. How will this affect Ford’s supply levels? P Q 5. A forest fire destroys thousands of acres of woodlands about to be harvested. This will cause the Harlan Cabinet Company to ______________________ its supply of cabinets. P Q 6. A development firm has bought all the land around a large lake in northern Arkansas. The local government places a high property tax on the land to raise money for a nearby school. What type of supply does the land have? P Q 7. A government agency feels too much wheat is being produced and stops all subsidies to wheat farmers for one year. This will cause wheat production to __________________. P Q 8. Chevrolet announces it will stop production of Corvettes after next year. Furthermore, the final edition Corvette is a limited series and only 5,000 will be produced. Draw the supply curve for Corvette production for next year. P Q


