Linear Relations & Patterns Review Worksheet
advertisement
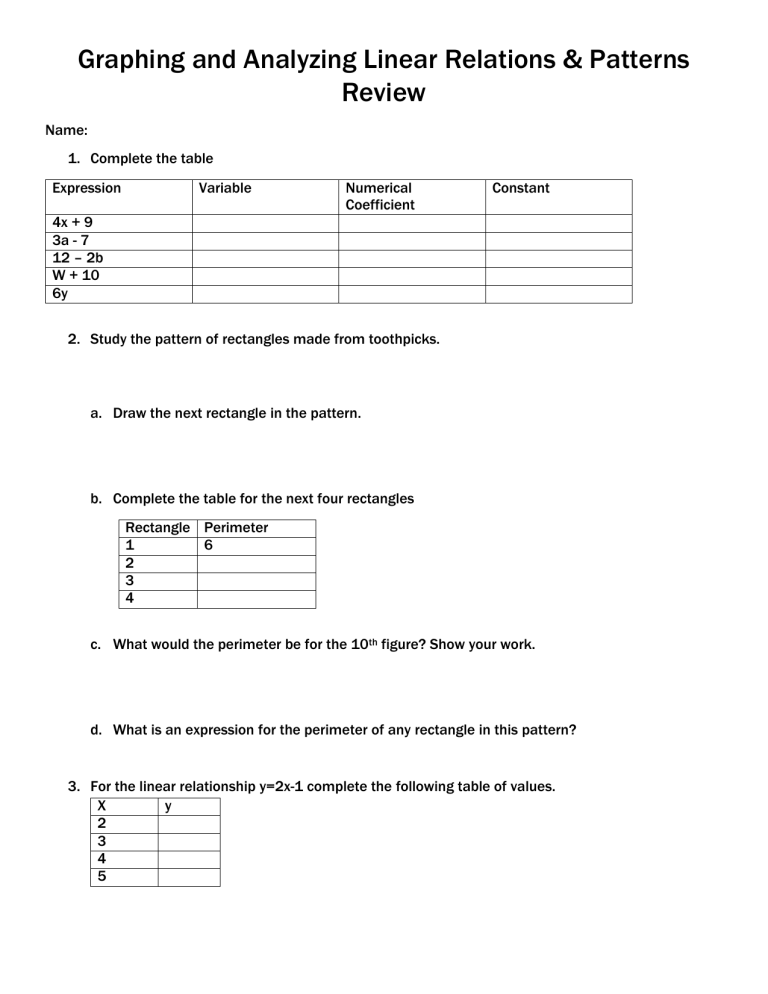
Graphing and Analyzing Linear Relations & Patterns Review Name: 1. Complete the table Expression Variable Numerical Coefficient Constant 4x + 9 3a - 7 12 – 2b W + 10 6y 2. Study the pattern of rectangles made from toothpicks. a. Draw the next rectangle in the pattern. b. Complete the table for the next four rectangles Rectangle Perimeter 1 6 2 3 4 c. What would the perimeter be for the 10th figure? Show your work. d. What is an expression for the perimeter of any rectangle in this pattern? 3. For the linear relationship y=2x-1 complete the following table of values. X y 2 3 4 5 4. Graph the values in the table onto the coordinate grid. 4. Describe a pattern in real life that the relation could represent. Make sure you explain what both x and y represent. 5. Complete the following table. X 1 2 3 y 2 5 8 4 5 7. What is the rule for finding any number in the above pattern? 8. What would the 20th number be? 9. For each graph below is it possible to have point in between. Explain. Graph A: Graph B: 10. A flower shop charges $5 for three flowers on top of it birthday cakes. Each additional rose is $2. The rule that they is. T=2x+5. If you were to graph this would you connect the dot or not? Explain
