Density bar graph 2018
advertisement

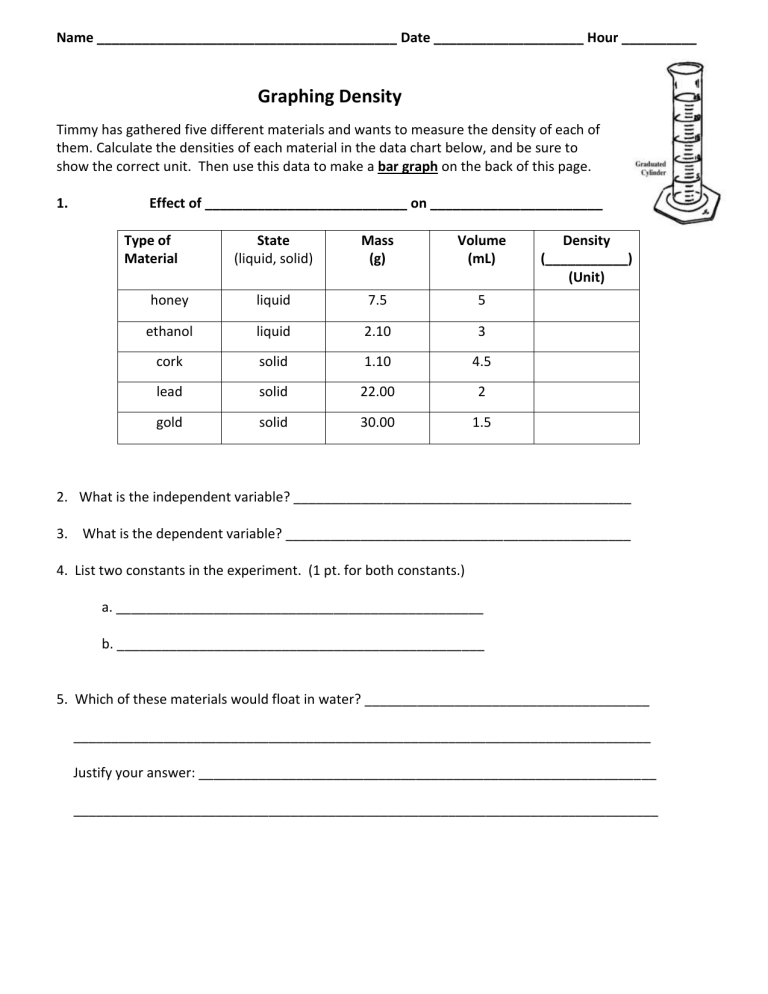
Name ________________________________________ Date ____________________ Hour __________ Graphing Density Timmy has gathered five different materials and wants to measure the density of each of them. Calculate the densities of each material in the data chart below, and be sure to show the correct unit. Then use this data to make a bar graph on the back of this page. 1. Effect of ___________________________ on _______________________ Type of Material State (liquid, solid) Mass (g) Volume (mL) honey liquid 7.5 5 ethanol liquid 2.10 3 cork solid 1.10 4.5 lead solid 22.00 2 gold solid 30.00 1.5 Density (___________) (Unit) 2. What is the independent variable? _____________________________________________ 3. What is the dependent variable? ______________________________________________ 4. List two constants in the experiment. (1 pt. for both constants.) a. _________________________________________________ b. _________________________________________________ 5. Which of these materials would float in water? ______________________________________ _____________________________________________________________________________ Justify your answer: _____________________________________________________________ ______________________________________________________________________________ Make a bar graph. Be sure to complete the title and the proper labels and units for the X and Y axis. Use an appropriate scale. Then answer the questions which follow. W h i c h o f t h e s e m a t 6. Title______ 7. X Axis ______ 8. Y Axis ______ 9. Scale ______ 10. Graphing/spacing _______ 11. If liquid lead were poured into liquid gold, and their densities were similar to those as when they each are solids, what would happen? ___________________________________________________________________________ 12. Justify your answer: ___________________________________________________________________________


