NMR Fluid Typing Halliburton
advertisement

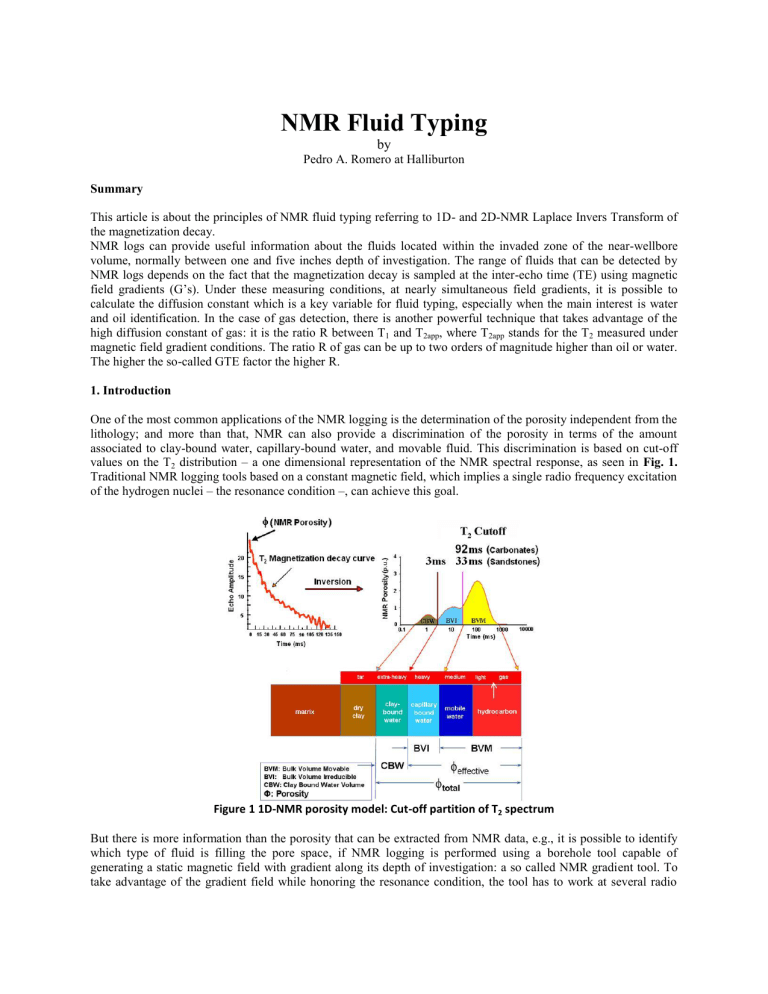
NMR Fluid Typing by Pedro A. Romero at Halliburton Summary This article is about the principles of NMR fluid typing referring to 1D- and 2D-NMR Laplace Invers Transform of the magnetization decay. NMR logs can provide useful information about the fluids located within the invaded zone of the near-wellbore volume, normally between one and five inches depth of investigation. The range of fluids that can be detected by NMR logs depends on the fact that the magnetization decay is sampled at the inter-echo time (TE) using magnetic field gradients (G’s). Under these measuring conditions, at nearly simultaneous field gradients, it is possible to calculate the diffusion constant which is a key variable for fluid typing, especially when the main interest is water and oil identification. In the case of gas detection, there is another powerful technique that takes advantage of the high diffusion constant of gas: it is the ratio R between T1 and T2app, where T2app stands for the T2 measured under magnetic field gradient conditions. The ratio R of gas can be up to two orders of magnitude higher than oil or water. The higher the so-called GTE factor the higher R. 1. Introduction One of the most common applications of the NMR logging is the determination of the porosity independent from the lithology; and more than that, NMR can also provide a discrimination of the porosity in terms of the amount associated to clay-bound water, capillary-bound water, and movable fluid. This discrimination is based on cut-off values on the T2 distribution – a one dimensional representation of the NMR spectral response, as seen in Fig. 1. Traditional NMR logging tools based on a constant magnetic field, which implies a single radio frequency excitation of the hydrogen nuclei – the resonance condition –, can achieve this goal. Figure 1 1D-NMR porosity model: Cut-off partition of T2 spectrum But there is more information than the porosity that can be extracted from NMR data, e.g., it is possible to identify which type of fluid is filling the pore space, if NMR logging is performed using a borehole tool capable of generating a static magnetic field with gradient along its depth of investigation: a so called NMR gradient tool. To take advantage of the gradient field while honoring the resonance condition, the tool has to work at several radio frequencies at different depths of investigation. Wireline NMR tools can generate up to six different radio frequencies (RF), having a depth of investigation between one and five inches. The reason why a NMR gradient tool is needed for fluid typing lies in the nature of the NMR signal, as it depends not only on the pore size distribution for the wetting phase under fast-diffusion limit constraint, and the fluid viscosity for the non-wetting phase, but also on the coupling between the fluid’s diffusion constant and tool parameters, such as G and TE. Appropriate postprocessing software identifies water and hydrocarbons and generates the corresponding fluid saturations by combining the acquired data in the most efficient way to enhance fluid contrast. Consequently, T 2 distributions for hydrocarbons and water can be generated using a forward model. The 1D-NMR refers to basic GTE left shift of the T2 spectra and also to the forward modeling of hydrocarbons and water inversion. The 2D-NMR is associated with Diffusion-T2 and T1-T2 maps. The gradient strength of the NMR tool decreases with frequency. The gradient feature makes it possible to excite multiple sensitive volumes in one single polarization time using a frequency-interleaving method. The operating frequency band ranges from mid-400 KHz to nearly 1 MHz, with sufficient frequency separation between frequencies to avoid interference from the excitations in neighboring sensitive volumes. Because the magnitude of the tool’s field gradient varies with frequency, the echo trains acquired with different frequencies can exhibit different apparent decay, even if they are acquired with identical acquisition parameters, such as TE and wait time (TW). The multi-frequency capability of the tool allows the acquisition of a large number of echo trains in a single pass, yielding both formation and fluid properties. The data acquisition can be adjusted according to the expected fluid in the formation, e.g. heavy oil, light oil, or gas. In any of these modes the porosity and permeability are also calculated. All the acquired echo trains satisfy the following equation: E ( f j , k , TE) 2G 2j TEm2 D fluid k TEm , p M exp exp k TE i i i T m 12 2i N _ comp (1) where i, j, k, and m are indices for the ith T2 component, jth frequency, kth echo train and mth TE respectively, and TWl pi 1 exp T1i (2) is the polarization factor for the ith T1 component and lth wait time TWl. In general the rate of transversal relaxation is given by the following equation: 1 1 1 1 T 2 app T2 S T2 B T2 D S 1 ( G TE ) 2 D V T2 B 12 1 S 1 . T2 int V T2 B (3) (4) The surface relaxation term ρ·S/V accounts for the interaction between the wetting fluid and the pore surface. The bulk relaxation rate 1/T2B is direct proportional to the viscosity. The 1/T 2D term represents the influence of tool parameters such as G and TE on the relaxation rate. From the above equations follows that T 2int is always equal or greater than T2app. This paper presents a summary of NMR physics models for fluid typing and post-processing techniques starting with the basic GTE and forward modeling, and concluding with 2D-NMR maps. The 1D-NMR refers to basic GTE left shift of the T2 spectra and also to the forward modeling of hydrocarbons and water inversion. The 2D-NMR is associated with Diffusion-T2 and T1-T2 maps. The paper also provides some references about case studies where the use of a magnetic field gradient has been of great advantage for understanding the fluid types in the formation. 2 One-Dimensional Fluid Typing (1D-NMR) 2.1 GTE method: Magnetic field gradient times inter-echo spacing Taking advantage of the gradient field and following the above given equations describing the relaxation rate, one can try to identify the hydrocarbon types and water from changes in the T 2 spectra displayed for different GTE values. It is known that the diffusion constant of gas is in the order of 10 -7 m2/s, almost two orders of magnitude higher than of water and four orders higher than of heavy oil. Considering these diffusivity contrasts and knowing how far the maximum water-T2 can be at a given GTE, it could be possible to even visually identify fluids by comparing the shifts on T2 spectra at different GTE tracks, as shown in Fig. 2 below. Figure 2 T2 spectra displayed for different GTE values [1] This effort can be very unpractical and time consuming though. Even if the log analyst is very well trained, the evaluation is always heavily depending on personal perception, bias or experience. 2.2 Simultaneous Inversion of Multiple Echo Trains - A forward modeling approach Simultaneous Inversion of Multiple Echo Trains is based on the forward modeling of tool responses from fluid and formation properties (Sheng et al., 2004). It is used to invert simultaneously multiple echo trains to obtain the T 2 relaxation time distributions corresponding to various reservoir fluids. The fluid properties, such as hydrogen index (HI), diffusivity (D), ratio of T1/T2int, and the T2int distribution ranges for the specified fluid types can be input by the user or imported from an appropriate simulator (e.g., a Fluid Property Calculator). Alternatively, D, T1, or sometimes T1/T2, can be inverted from the multiple echo trains. After the relaxation time distributions of the fluids are separated, the partial porosity filled with clay-bound water, irreducible water, free water and/or hydrocarbons are derived and the fluid saturations are obtained. A typical output of a forward-modeling-based post processing of NMR data is shown in Fig. 3. The T2 spectra for water and for oil are shown on track 5 and 6 respectively. It is worth mentioning that the generated T 2 distributions correspond to T2int, which is without any influence of the gradient G. The simultaneous inversion also can also solve for the presence of several types of hydrocarbons e.g. gas and oil. In the case of a well drilled with oil-based mud, the filtrate can be understood as an additional fluid whose properties have to be considered in the input parameters. Figure 3 SIMET log display output from [1] 3. Two-Dimensional Fluid Typing (2D-NMR) There are basically two types of 2D-NMR post-processing normally used in the industry: One is the D-T2int and the other T1-T2app. These processing products generate continuous maps in depth an estimation of the volumetric. Compared to the traditional 1D T2-spectrum-based interpretation methodology, 2D-NMR enhances the capability to discern different fluid phases by mapping proton density as a function of the T 2 relaxation time in the first parameter dimension and diffusion constant (or T 1 relaxation time or T1/T2app ratio) in the second parameter dimension simultaneously 3.1 Diffusivity-T2int Maps (D-T2int maps) The D-T2int maps take advantage of both T 2 intrinsic and Diffusivity contrast for fluid typing purposes. It allows differentiating between CBW, BVI, BVWM, oil and gas. It also discriminates between BVI and heavy oil volumes, a necessary step for correcting the Timur-Coates permeability model in the presence of movable heavy oil. The basic principle behind the D-T2int maps is the fact that fluids can be differentiated not only due to their relaxation time T2, or T2int, but also due to contrast in the Diffusivity value. Because of that, water, oil or gas normally appears at different zones on the map. The maps overcome the drawback of the 1D spectra, where overlapping of fluids contributions to one-dimensional T2 or Diffusivity can easily happen. Similar to the 1D-T2 spectrum, the 2D-NMR technique requires no prior knowledge of the fluid properties. The fluid typing is based on parameter separation in the Diffusivity and T2int domains, presented in the form of a two-dimensional map. When we use only the fully polarized echo trains, the 2D inversion model for D-T2int inversion is described by N M (tk ) n1 L M l 1 O ,l ,n t D ( G TE)tk exp k l 12 T2 int,n . (5) Fig. 4A shows the general representation of the reservoir fluids on a Diffusivity-T2int map. The 2D-T2 technique requires no prior knowledge of the fluid properties. The fluid typing is based on parameter separation in the Diffusivity and T2int domains, presented in the form of a two-dimensional map as also shown in a field example in Fig. 4B. Figure 4 A) schematic D-T2 map and B) Real data derived D-T2int showing heavy oil spot, clay bound water (cbw), movable water volume (bvmw)and water based mud filtrate(wbmf) from [1]. The Fig. 5 below showS a T1-T2app field case (Jerath et. Al, 2012) where five distinct fluids can be identify from the map. The T1 and T2app projections show the lack of spectral resolution to identify the fluid signatures. The associated tables show the evaluation of the T1-T2app maps in terms of the fluid’s occupied partial porosity. Figure 5 D-T2int map - A field example [2] Table 1 Partial porosity table for fluids calculated from T1-T2app map [2] 3.2 T1-T2app maps The magnetization decay as a function of time t and wait time TW of the PoroPerm+Gas acquisition sequence can be represented by M (t , TW ) f (T2 app, T1 )(1 eTW / T1 )e t / T2 app dT1dT2 app , (6) where M is the echo amplitude and f is the two dimensional porosity distribution function. The two dimensional term here represents the two dimensions in the parameter domain, T 1 and T2app. The polarization factor, 1− e−TW /T1, is of key importance in analyzing the data because different fluid types have different T 1. The echo decay factor, e−t/T2app, is not only determined by the fluid properties but also is controllable by the acquisition parameters G and TE as shown before. Fig. 6 shows all the details of a typical example of 2D-NMR analysis based on T1 and T2app. The colored intensity map is a 2D porosity histogram, where the abscissa and ordinate represent the T 1 and T2app values, respectively. The NMR total porosity is the sum of all intensities over the entire map. The T 1 spectrum (Fig. 6a) is obtained by summing the intensity values along the T2app dimension. The Fig. 6b shows the map with diagonal lines given by the ratio R. The T2app spectrum (Fig. 6c) is calculated in the same manner along the perpendicular axis, (Meridji et. al., SPE). The map shows typical spots for bound and movable water along the lower diagonal. Low GOR oil is interpreted as having high T1 and T2app. The spot at high T1 but lower T2app is a typical high GOR hydrocarbon signal. Figure 6 2D NMR in the presence of WBM [3] 4 Conclusions NMR is a very significant tool for detecting and quantifying different types of fluids. 2D-NMRTechniques like forward modeling as D-T2int and T1-T2app maps are powerful techniques for fluid typing. Nomenclature t = time from the beginning of an echo train TW = wait time TE = interecho time γ = proton gyromagnetic ratio D = molecular diffusion constant G = magnetic field gradient p = porosity distribution function T1 = longitudinal relaxation time T2 = transverse relaxation time T2int = intrinsic T2 T2app = apparent T2 M = NMR signal amplitude R = T1/T2app ratio SNR = Signal- to- noise-ratio CBW = Clay-bound water BVI = Capillary-bound water BVM = Movable fluid BVMW = Bulk volume of movable water WBMF = Water-based mud filtrate. 8. References 1. PEDRO ROMERO1, QIAN ZHANG, Baker Hughes: FLUID TYPING FROM NMR LOGGING WITH GRADIENT MAGNETIC FIELD, Rio Oil and Gas, paper IBP2158_10, September 13th-16th, 2010, Rio de Janeiro, Brazil. 2. KANAY JERATH AND CARLOS TORRES-VERDÍN, University of Texas at Austin: IMPROVED ASSESSMENT OF IN-SITU FLUID SATURATION WITH MULTI-DIMENSIONAL NMR MEASUREMENTS AND CONVENTIONAL WELL LOGS, SPWLA, 53rd Annual Logging Symposium, Cartagena, Colombia, June 16th -20th, 2012. 3. YACINE MERIDJI AND GABOR HURSAN, Saudi Aramco, MAHMOUD EID AND RON BALLIET, Halliburton: FLUID IDENTIFICATION IN COMPLEX CLASTIC RESERVOIRS USING 2D NMR MAPS: A CASE STUDY FROM SAUDI ARABIA, SPE Annual Technical Symposium & Exhibition held in Al-Khobar, Saudi Arabia, May 19th-22nd, 2013. 1 At Halliburton since 2012


