Comparison of Maximum Induced Current and Electric Field
advertisement
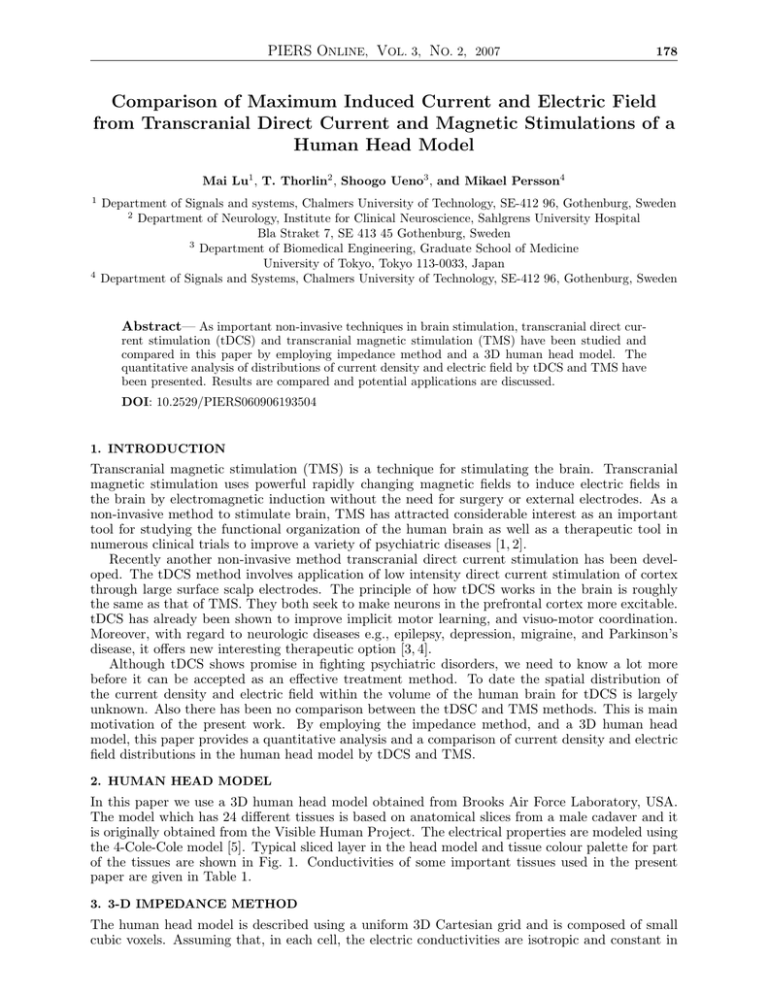
PIERS ONLINE, VOL. 3, NO. 2, 2007 178 Comparison of Maximum Induced Current and Electric Field from Transcranial Direct Current and Magnetic Stimulations of a Human Head Model Mai Lu1 , T. Thorlin2 , Shoogo Ueno3 , and Mikael Persson4 1 4 Department of Signals and systems, Chalmers University of Technology, SE-412 96, Gothenburg, Sweden 2 Department of Neurology, Institute for Clinical Neuroscience, Sahlgrens University Hospital Bla Straket 7, SE 413 45 Gothenburg, Sweden 3 Department of Biomedical Engineering, Graduate School of Medicine University of Tokyo, Tokyo 113-0033, Japan Department of Signals and Systems, Chalmers University of Technology, SE-412 96, Gothenburg, Sweden Abstract— As important non-invasive techniques in brain stimulation, transcranial direct current stimulation (tDCS) and transcranial magnetic stimulation (TMS) have been studied and compared in this paper by employing impedance method and a 3D human head model. The quantitative analysis of distributions of current density and electric field by tDCS and TMS have been presented. Results are compared and potential applications are discussed. DOI: 10.2529/PIERS060906193504 1. INTRODUCTION Transcranial magnetic stimulation (TMS) is a technique for stimulating the brain. Transcranial magnetic stimulation uses powerful rapidly changing magnetic fields to induce electric fields in the brain by electromagnetic induction without the need for surgery or external electrodes. As a non-invasive method to stimulate brain, TMS has attracted considerable interest as an important tool for studying the functional organization of the human brain as well as a therapeutic tool in numerous clinical trials to improve a variety of psychiatric diseases [1, 2]. Recently another non-invasive method transcranial direct current stimulation has been developed. The tDCS method involves application of low intensity direct current stimulation of cortex through large surface scalp electrodes. The principle of how tDCS works in the brain is roughly the same as that of TMS. They both seek to make neurons in the prefrontal cortex more excitable. tDCS has already been shown to improve implicit motor learning, and visuo-motor coordination. Moreover, with regard to neurologic diseases e.g., epilepsy, depression, migraine, and Parkinson’s disease, it offers new interesting therapeutic option [3, 4]. Although tDCS shows promise in fighting psychiatric disorders, we need to know a lot more before it can be accepted as an effective treatment method. To date the spatial distribution of the current density and electric field within the volume of the human brain for tDCS is largely unknown. Also there has been no comparison between the tDSC and TMS methods. This is main motivation of the present work. By employing the impedance method, and a 3D human head model, this paper provides a quantitative analysis and a comparison of current density and electric field distributions in the human head model by tDCS and TMS. 2. HUMAN HEAD MODEL In this paper we use a 3D human head model obtained from Brooks Air Force Laboratory, USA. The model which has 24 different tissues is based on anatomical slices from a male cadaver and it is originally obtained from the Visible Human Project. The electrical properties are modeled using the 4-Cole-Cole model [5]. Typical sliced layer in the head model and tissue colour palette for part of the tissues are shown in Fig. 1. Conductivities of some important tissues used in the present paper are given in Table 1. 3. 3-D IMPEDANCE METHOD The human head model is described using a uniform 3D Cartesian grid and is composed of small cubic voxels. Assuming that, in each cell, the electric conductivities are isotropic and constant in PIERS ONLINE, VOL. 3, NO. 2, 2007 cut z=120 mm 250 250 200 200 150 150 y [mm] z [mm] cut y=110 mm 100 100 50 50 0 0 50 100 x [mm] 150 179 200 (a) 0 0 50 100 x [mm] 150 200 (b) (c) Figure 1: Typical sliced layers in human head model. (a) cross section at y = 110 mm, (b) cross section at z = 120 mm, (c) Tissue color Palette. Table 1: Tissue properties used in the calculations. Tissue BLOOD BONE.MARROW CEREB.SPIN.FL FAT LIGAMENTS NERVE.(spine) GRAY.MATTER WHITE.MATTER SKIN-DERMIS Conductivity σ[S/m] (TMS case) 7.00e-01 2.52e-3 2.00e+00 2.34e-02 3.85e-01 3.21e-02 1.07e-01 6.55e-02 2.01e-4 Conductivity σ[S/m] (tDCS case) 7.00e-01 5.00e-04 2.0e+00 1.00e-02 2.5e-01 6.00e-03 2.00e-02 2.00e-02 2.00e-04 all direction, the model is represented as a 3D network of impedances. The impedances for various directions can be written as ∆m i, j, k Zm = (1) ∆n∆p(σ + jω²) where i, j, k indicate the cell index; ∆m, ∆n, and ∆p are the size of the voxels in m, n, p directions. σ and ² are the conductivity and the electrical permittivity for the voxel(i, j, k). Kirchoff voltage law around each loop in this network generates a system of equations for the loop currents. In the case of TMS, these loop currents are driven by Faraday induction from the magnetic field of the applicator. In the tDCS case, the currents are injected at the electrodes and then distributed according to the Kirchoff laws. This system of equations is solved numerically using a standard iterative method. The net induced currents within the head are then calculated from these known loop currents. The induced electric field is in turn calculated from the net induced currents using the Ohm’s law. Details implementation of the impedance method can be found in[6–8]. 4. RESULTS AND DISCUSSIONS For the tDCS calculation, we use a pair of large surface scalp electrodes with an area of 35cm2 that are placed on the 3D head model in the bilateral position, as shown in Fig. 2(a). A direct current of 1 mA is injected from right electrode and extracted the same current on the left side. For the TMS calculation, we design a TMS coil with figure of eight shaped and place it near the left side of head model (Fig. 2(b)). It consists of two circular coils with inner radius of 10 mm, and outer radii 50 mm, and the number of wire turns in each wing is nr = 10. A typical clinic application current (sine wave with current amplitude I = 7.66 kA, and working frequency f = 3.6 kHz with repetition of 20 Hz) was implemented in the calculations. By employing the impedance method as described in Section 3, the current density J and electric PIERS ONLINE, VOL. 3, NO. 2, 2007 (a) 180 (b) Figure 2: tDCS patch and TMS coil placed on the human head model. (a) tDCS, (b) TMS. field E are calculated, and the results for tDCS and TMS cases are shown in Table 2 and Table 3, respectively. Table 2: Maximum values of current density J, electric field E and their 95%-CI in different tissues for tDCS case. Tissue Name BLOOD.......... BODY.FLUID..... BONE.MARROW.... CARTILAGE...... CEREB.SPIN.FL.. EYE.(lens)..... FAT............ GLANDS......... LIGAMENTS...... MUSCOUS.MEMB... MUSCLE......... NERVE.(spine).. GRAY.MATTER.... WHITE.MATTER... CEREBELLUM..... SKIN-DERMIS.... |J| [mA/m2 ] 5.6e+02 2.4e+01 1.1e+03 1.1e+02 2.5e+03 1.1e+02 1.2e+04 3.4e+02 8.6e+03 6.2e+02 7.8e+03 3.7e+02 9.9e+02 3.5e+02 2.2e+02 1.0e+04 95%-CI [mA/m2 ] 4.0e+01 2.7e+00 1.3e+02 6.3e+00 1.6e+02 1.2e+01 7.6e+02 6.6e+00 1.1e+03 9.0e+01 1.5e+03 4.4e+01 8.9e+01 4.0e+01 2.0e+01 5.8e+02 |E| [mv/m] 8.0e+02 1.6e+01 2.1e+06 7.2e+02 1.2e+03 3.8e+02 1.2e+06 6.9e+02 3.4e+04 1.6e+06 3.9e+04 6.2e+04 5.0e+04 1.7e+04 5.4e+03 5.2e+07 95%-CI [mv/m] 5.7e+01 1.8e+00 2.7e+05 4.2e+01 8.0e+01 4.1e+01 7.6e+04 1.3e+01 4.3e+03 2.2e+05 7.6e+03 7.4e+03 4.4e+03 2.0e+03 4.9e+02 2.9e+06 (x, y, z) (unit: mm) (104, 73,174) (126, 74, 13) ( 72,126,197) (103, 20, 85) (144,132,163) (128, 48,110) ( 69,114,202) ( 90,109,100) ( 71,114,200) ( 98, 69,113) ( 71,125,202) ( 89,106,106) (133,137,163) ( 88,133,139) ( 64,147, 91) (112,137,208) For tDCS case, we know that fat (at x = 69 mm, y = 114 mm, z = 202 mm) and skin-dermis (at x = 112 mm, y = 137 mm, z = 208 mm) under the right patch exhibit maximum values of current density: |J| = 1.2 × 10⁴ mA/m2 , and |J| = 1.0 × 10⁴ mA/m2 , respectively. Skindermis (same position as above) and bone marrow (at x = 72 mm, y = 126 mm, z = 197 mm) under the left patch exhibits maximum values electric field: |E| = 5.2 × 10⁷ mV/m, and |E| = 2.1 × 10⁶ mV/m respectively. This means that the current density and the electric field in tDCS are mostly distributed in the skull. The distributions of current density |J| and electric field |E| at the cross sections have been illustrated in Fig. 3. From Table 2, we know that brain tissues, such as spine nerve has maximum value of current density |J| = 370 mA/m2 and electric field |E| = 6.2 × 10⁴ mV/m at the position (89, 106, 106). As we know this position is located in PIERS ONLINE, VOL. 3, NO. 2, 2007 181 Table 3: Maximum values of current density J, electric field E and their 95%-CI in different tissues for TMS case. Tissue Name BLOOD.......... BODY.FLUID..... BONE.MARROW.... CARTILAGE...... CEREB.SPIN.FL.. EYE.(lens)..... FAT............ GLANDS......... LIGAMENTS...... MUSCOUS.MEMB... MUSCLE......... NERVE.(spine).. GRAY.MATTER.... WHITE.MATTER... CEREBELLUM..... SKIN-DERMIS.... |J| [mA/m2 ] 3.8e+04 1.2e+04 2.7e+04 9.8e+03 4.1e+05 3.6e+04 9.7e+04 5.8e+04 2.9e+05 4.4e+04 1.8e+05 2.2e+04 1.3e+05 2.9e+04 2.2e+04 3.7e+04 95%-CI [mA/m2 ] 2.0e+03 1.3e+03 2.9e+03 1.0e+03 3.9e+04 4.2e+03 8.7e+03 5.9e+03 3.0e+04 6.1e+03 6.3e+03 2.4e+03 1.1e+04 1.7e+03 1.9e+03 4.8e+03 |E| [mv/m] 5.5e+04 7.8e+03 1.1e+07 5.6e+04 2.0e+05 1.1e+05 4.2e+06 1.1e+05 7.5e+05 4.2e+07 5.3e+05 6.8e+05 1.2e+06 4.4e+05 1.7e+05 1.8e+08 95%-CI [mv/m] 2.9e+03 8.8e+02 1.2e+06 5.9e+03 2.0e+04 1.3e+04 3.7e+05 1.1e+04 7.8e+04 5.8e+06 1.9e+04 7.5e+04 1.0e+05 2.6e+04 1.5e+04 2.4e+07 (x, y, z) (unit: mm) ( 98, 56,155) (126, 74, 13) (156,112,144) (164,137, 82) (149,113,149) (135, 48,107) (158,102,152) (147, 58,104) (149,113,147) (106, 70,111) (158,103,151) (124, 65,106) (151,110,138) (150,115,130) (140,159, 82) (156, 64,100) the central and deep part of the brain. Since |E| = 6.2 × 10⁴ mV/m can be comparable with 100 mV/mm (the effective fields for electrically induced effects in living cells [9]), we believe tDCS can also play a role in deep brain stimulation. (a) (b) Figure 3: Current density (|J|) and electrical field (|E|) distributions for tDCS case. (a) |J| at the cross section y = 114 mm, (b) |E| at the cross section y = 137 mm. For TMS case, cerebro spinal fluid (at x = 149 mm, y = 113 mm, z = 149 mm), and ligaments (at x = 149 mm, y = 113 mm, z = 147 mm) at the coil side exhibit maximum values of current density |J| = 4.1 × 10⁵ mA/m2 , and |J| = 2.9 × 10⁵ mA/m2 , respectively. Electric field exhibits maximum values |E| = 1.8 × 10⁸ mV/m in skin (at x = 156 mm, y = 64 mm, z = 100 mm) at the coil side, and |E| = 4.2 × 10⁷ mV/m in muscous membranes (at x = 106 mm, y = 70 mm, z = 111 mm) in the deep part of the brain. This means during TMS implementation, current density will mostly distributed in the brain area, because the applied magnetic field can easily penetrate the skull. While electric field will be distributed in the scalp as well as in the brain. Fig. 4 illustrates the distribution of current density |J| and electric field |E| in cross sections in TMS case. PIERS ONLINE, VOL. 3, NO. 2, 2007 (a) 182 (b) Figure 4: Current density (|J|) and electrical field (|E|) distributions for TMS case. (a) |J| at the cross section y = 113 mm, (b) |E| at the cross section y = 64 mm. In the head model with 1 mm resolution, the thickness of the tissues is often close to the grid size, and severe staircasing will locally perturb the calculation. A statistical analysis was thus carried out to estimate the maximum |J| and |E| with a 95% confidence interval (95%-CI). Table 2 and Table 3 summarise 95%-CI in various tissues for tDCS case and TMS case, respectively. For example, the relative errors of |J| and |E| in skin for tDCS case are 5.8% and 5.6%, respectively, while in the brain tissue i.e., white matter, the estimated relative errors are 11.4% for |J| and 11.7% for |E|, which also reveals a fact that tDCS causes large current density and electric field levels in the skull. Theoretical studies show that a nerve is activated by the first derivative of the component of an induced electric field along the nerve, the so called activating function, during magnetic stimulation [10, 11]. It is important to investigate the activating functions in human brain by tDCS, and TMS, and the precise study will be reported soon. REFERENCES 1. Post, R. M., T. A. Kimbrell, U. D. McCann, R. T. Dunn, E. A. Osuch, A. M. Speer,and S. R. B. Weiss, “Repetitive transcranial magnetic stimulation as a neuropsychiatric tool: present status and future potential,” Journal of ECT, Vol. 15, No. 1, 39–59, 1999. 2. Ueno, S., “Biomagnetic approaches to studying the brain,” IEEE Engineering in Medicine and Biology, Vol. 18, No. 3, 108–120, 1999. 3. Nitsche, M. A., A. Schauenburg, N. Lang, D. Liebetanz, C. Exner, W. Paulus, and F. Tergau, “Facilitation of implicit motor learning by weak transcranial direct current stimulation of the primary motor cortex in the human,” J. Cong. Neurosci, Vol. 15, No. 4, 619–626, 2003. 4. Liebetanz, D., F. Fregni, K. K. Monte-Silva, M. B. Oliveira, et al., “After-effects of transcranial direct current stimulation (tDCS) on cortical spreading depression,” Neuroscience Letters, Vol. 398, No. 1–2, 85–90, 2006. 5. Cole, K. S. and R. H. Cole, “Dispersion and absorption in dielectrics: alternating current characteristics,” J. Chem. Phys., Vol. 9, No. 9, 341–351, 1941. 6. Orcutt, N. and O. P. Gandhi, “A 3-D impedance method to calculate power deposition in biological bodies subjected to time varying magnetic fields,” IEEE Trans. on Biomedical Engineering, Vol. 35, No. 8, 577–583, 1988. 7. Nadeem, M., T. Thorlin, O. P. Gandhi, and M. Persson, “Computation of electric and magnetic stimulation in human head using the 3D impedance method,” IEEE Trans. on Biomedical Engineering, Vol. 50, No. 7, 900–907, 2003. 8. Nadeem, M., Y. Hamnerius, K. H. Mild, and M. Persson, “Magnetic field from spot welding equipment — Is the basic restriction exceeded?,” Bioelectromagnetics, Vol. 25, No. 4, 278–284, 2003. PIERS ONLINE, VOL. 3, NO. 2, 2007 183 9. Robinson, K. R. and M. A. Messerli, “Electric embryos: The embryonic epithelium as a generator of developmental information,” Frontiers in Neurobiology 2: Nerve Growth and Guidance, 131–141, C. D. MCCaig, Ed. London, U.K., Portland, 1996. 10. Roth, B. J. and P. J. Basser, “A model of the stimulation of a nerve fiber by electromagnetic induction,” IEEE Trans. Biomed.Eng., Vol. 37, No. 4, 588–597, 1990. 11. Liu, R. and S. Ueno, “Calculating the activating function of nerve excitation in inhomogeneous volume conductor during magnetic stimulation using the finite element method,” IEEE Trans. Magn., Vol. 36, No. 4, 1796–1799, 2000.
