Magnetic induction with Cobra3
TEP
Principle
A magnetic field of variable frequency and varying strength is produced in a long coil. The
voltages induced across thin coils which are pushed into the long coil are determined as a
function of frequency and field strength of the magnetic field and the number of turns and
the cross-section of the induction coil.
Related topics
Maxwell’s equations, electrical eddy field, magnetic field of coils, coil, magnetic flux, induced
voltage.
Tasks
Determination of the induction voltage as a function
1. of the strength of the magnetic field,
2. of the frequency of the magnetic field,
3. of the number of turns of the induction coil,
4. of the cross-section of the induction coil.
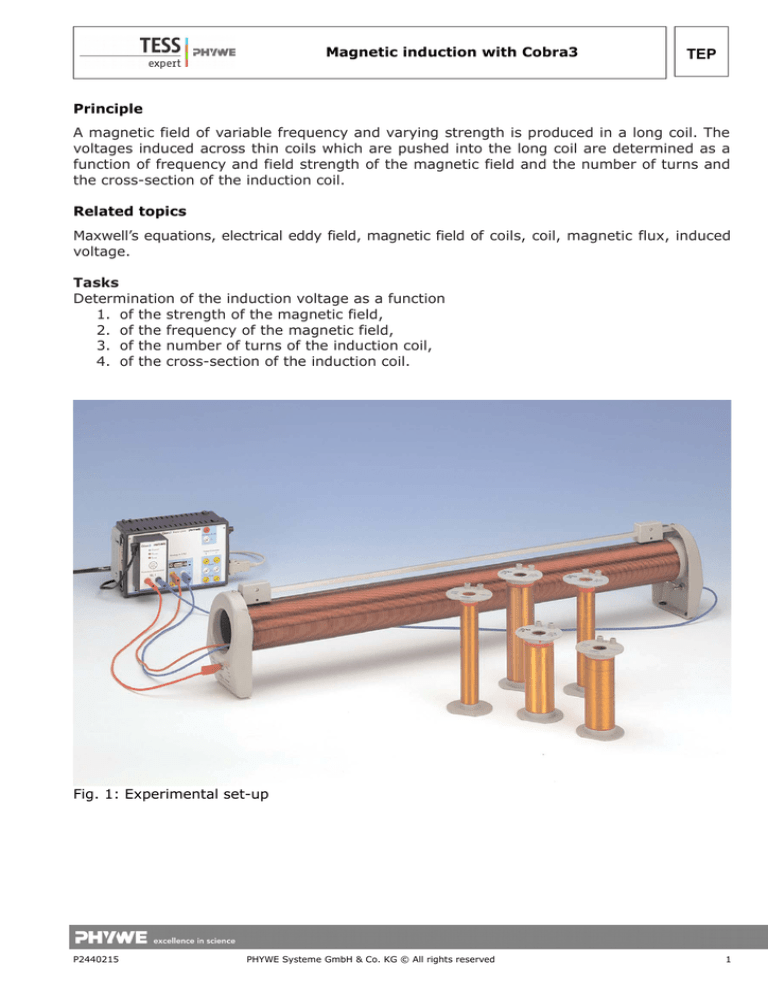
Fig. 1: Experimental set-up
P2440215
PHYWE Systeme GmbH & Co. KG © All rights reserved
1
TEP
Magnetic induction with Cobra3
Equipment
1
1
1
1
1
1
1
1
2
1
1
1
2
1
1
1
Field coil, 750 mm, 485 turns/m
Induction coil, 300 turns, dia. 40 mm
Induction coil, 300 turns, dia. 32 mm
Induction coil, 300 turns, dia. 25 mm
Induction coil, 200 turns, dia. 40 mm
Induction coil, 100 turns, dia. 40 mm
Induction coil, 150 turns, dia. 25 mm
Induction coil, 75 turns, dia. 25 mm
Connecting cord, 32 A, 750 mm, red
Connecting cord, 32 A, 750 mm, blue
Connecting cord, 32 A, 2000 mm, blue
Cobra3 Basic Unit
Power supply, 12 V
RS 232 data cable
PowerGraph Software
Cobra3 Function generator module
PC, Windows® 95 or higher
11001-00
11006-01
11006-02
11006-03
11006-04
11006-05
11006-06
11006-07
07362-01
07362-04
07365-04
12150-00
12151-99
14602-00
14525-61
12111-00
Set-up and Procedure
Set up the equipment as seen in Fig.1. The field generating coil is connected to the function
generator module and the induction coils to be put into the field generating coil are
connected to "Analog In 2 / S2", best to the two yellow sockets (+ and −) and not to
ground.
Connect the Cobra3 Basic Unit to the computer port COM1, COM2 or to USB port (for USB
computer port use USB to RS232 Converter 14602-10) and start the "measure" program.
Select "Gauge" > "PowerGraph" and on the now visible "Setup" chart click the function
generator symbol. Use the function generator in the constant current mode – the produced
field strength depending on the current strength is of interest and not the voltage that is
needed to produce it.
First use the function generator to produce a current ramp at a fixed frequency. Set the
parameters as seen on Fig. 2.
2
PHYWE Systeme GmbH & Co. KG © All rights reserved
P2440215
Magnetic induction with Cobra3
TEP
Fig. 2: Function generator module settings for the
amplitude ramp
P2440215
PHYWE Systeme GmbH & Co. KG © All rights reserved
3
TEP
Magnetic induction with Cobra3
Fig 3
Then click the "Analog In 2 / S2" symbol and set the module to "Burst measurement" as
seen in Fig. 3.
The "Settings" and "Display" charts of PowerGraph should look like Fig. 4 and Fig. 5.
Fig. 4: The "Settings" chart of PowerGraph for amplitude ramp
4
PHYWE Systeme GmbH & Co. KG © All rights reserved
P2440215
Magnetic induction with Cobra3
TEP
Fig 5: "Displays" chart of PowerGraph
Take a measurement for each of the induction coils. Start measuring with the "Continue"
button.
(If you plan to make a logarithmic plot, correct the resulting curves by subtracting the
value at zero current I from all values using "Analysis" > "Channel modification…" with "U2"
as "Source channel". The zero offset is due to digital noise and voltage induced from stray
fields and may be regarded as constant during one measurement but may change slightly
from measurement to measurement due to different arrangements of your cables. The
offset deforms the logarithmic plot strongly but does not matter in a normal plot.)
Note down the slope of the curve evaluated with the "Regression" tool of "measure" (in the
linear plot).
Then set the function generator on the "Setup" chart of PowerGraph to tune the frequency
from 100 to 1000 Hz with constant current strength, i.e. constant magnetic field amplitude.
See Fig. 6 for suitable settings. The "Settings" chart of PowerGraph should look like Fig. 7.
Again take a measurement of each of the induction coils.
(The correction of the zero offset may be done using the "Regression" tool of "measure":
Subtract the value delivered by the "Regression" function as zero offset from the "U2" data
using again "Analysis" > "Channel modification…".)
Note down the slope values for further evaluation.
P2440215
PHYWE Systeme GmbH & Co. KG © All rights reserved
5
TEP
Magnetic induction with Cobra3
Fig. 6: Module settings for frequency ramp
6
PHYWE Systeme GmbH & Co. KG © All rights reserved
P2440215
Magnetic induction with Cobra3
TEP
Fig. 7: "Settings" chart for frequency ramp
Theory and evaluation
For the first part with the constant frequency the obtained data may look like Fig. 8 if put
into one single diagram with "Measurement" > "Assume channel…" and scaled to the same
value with "Scale curves".
Fig. 8: Voltage response of the different coils vs. current in
the field generating coil for fixed frequency of 800 Hz
P2440215
PHYWE Systeme GmbH & Co. KG © All rights reserved
7
TEP
Magnetic induction with Cobra3
Use the function "Regression" of "measure" to evaluate the slopes of the recorded
measurement data yielding the response voltage of the induction coils per current strength
in the field coil in V/A.
Plot the response voltage per mA for induction coils with the same diameter but different
number of turns vs. the number of turns and plot the response voltage per mA for
induction coils with the same number of turns but different diameters vs. the cross-section
area corresponding to the diameter. Use "Measurement" > "Enter data manually…" to do
so. Fig. 9 and Fig. 10 show possible results.
Fig. 9: Voltage response vs. number of turns at constant crosssection area
8
PHYWE Systeme GmbH & Co. KG © All rights reserved
P2440215
Magnetic induction with Cobra3
Fig. 10: Voltage response
constant number of turns
vs.
cross-section
area
TEP
with
Fig. 11 shows the voltage response of the induction coil in dependency of the frequency of
the field. With the data of Fig. 11 an analogous evaluation is possible.
Fig. 11: Voltage response vs. frequency
P2440215
PHYWE Systeme GmbH & Co. KG © All rights reserved
9
Magnetic induction with Cobra3
TEP
For the comparison of the experimental data with theory two quantities must be
determined in relation to the experimental parameters:
1. The inducted voltage in the induction coil in dependence of the number of turns and
the cross sectional area of the induction coil and for a given field.
2. The magnetic field generated by the field coil in dependence of the length and the
number of turns of the field coil and in dependence of the current flowing through
the field coil. The generated magnetic field by the field coil is the given field for the
induction coil in this experiment.
Both relations follows from Maxwell’s laws and the experimental conditions.
Induction coil:
According to Maxwell's second law, the induced electric potential by a changing magnetic
flux ϕ(t) is the voltage U along a closed line C
⃗⋅d ⃗s = −
U = ∮C E
with
dφ
dt
φ (t) = ∫ A ⃗
B⋅d ⃗
A
(1)
(2)
⃗ is the area enclosed by the line C.
A
Inside the long field coil the magnetic field (given field for the induction coil) is spatial
homogenous and only the amount of the field can change in time. Furthermore the cross
⃗ of the induction coil is in a plane perpendicular to B
⃗ . Relation (2) can
sectional area A
therefore be written as
φ (t) = B (t)⋅A
(3)
Inserting (3) in (1) and taking into account that the induction coil consists out of n parallel
conductor loops yields
U (t) = −n⋅A
10
dB
dt
PHYWE Systeme GmbH & Co. KG © All rights reserved
(4)
P2440215
Magnetic induction with Cobra3
TEP
Fig. 12: Bilogarithmic plot induced voltage vs. field producing
current
Fig. 13: Bilogarithmic plot induced voltage vs. field frequency
P2440215
PHYWE Systeme GmbH & Co. KG © All rights reserved
11
Magnetic induction with Cobra3
TEP
Field coil:
Maxwell’s first law
μ 0∮A ⃗
B⋅d ⃗s = ∫ ⃗j⋅d ⃗
A
together with Maxwell's fourth law
∮A ⃗B⋅d ⃗A = 0
and
⃗
I = ∫A ⃗j⋅d A
results in
m
B (t) = μ 0 ⋅I ( t)
l
(5)
for the magnetic field generated by the field coil. µ0 = 1.26·10-6 Vs/Am is the magnetic field
constant, m is the number of turns and l the lengths of the field coil. The current that flows
through the field coil is denoted by I(t).
Finally combination of the result for the induction coil (4), the result for the field coil (5)
and I ( t) = I 0⋅sin (ω t) yields
U (t) = −μ 0 n A
m
⋅I cos (ω t)
l 0
(6)
or for the effective values
m
U eff = μ 0 ω⋅n A ⋅I eff
l
So the voltage Ueff on the induction coils should be proportional to
• the number of turns n of the induction coil
• the cross-sectional area A of the induction coil
• the number of turns m of the field coil
• the length l of the field coil
• the frequency ω of the current through the field coil
• the amount |I eff| of the current through the field coil.
(7)
The figures 8 to 11 display these proportionalities. The linear dependencies can be proved
with help of bilogarithmic plots. For the dependencies of the induced voltage on the
frequency and amount of the current through the field coil this is shown in Fig. 12 and 13.
12
PHYWE Systeme GmbH & Co. KG © All rights reserved
P2440215
Magnetic induction with Cobra3
TEP
From equation (7) follows
μ0 =
U
I eff⋅n⋅ω⋅A⋅n
for the magnetic field constant.
With ω = 2 π f = 5027 Hz ,
m
1
= 485
l
m
yields Fig. 9
for the area 1320 mm2=0.001320 m2 the slope 4.142 mV/(A·n), thus
−6
μ 0 = 1.29⋅10
Vs
Am
for the area 531 mm2=0.000531 m2 the slope 1.704 mV/(A·n), thus
−6
μ 0 = 1.32⋅10
Vs
Am
and Fig 10 yields
for 300 turns the slope 0.941 mV/(A·mm2), thus
μ 0 = 1.29⋅10−6
Vs
Am
These values fit quite well with the literature value of μ 0 = 1.29⋅10
−6
Vs
for the magnetic
Am
field constant.
P2440215
PHYWE Systeme GmbH & Co. KG © All rights reserved
13


