Performance Funding - Florida International University
advertisement

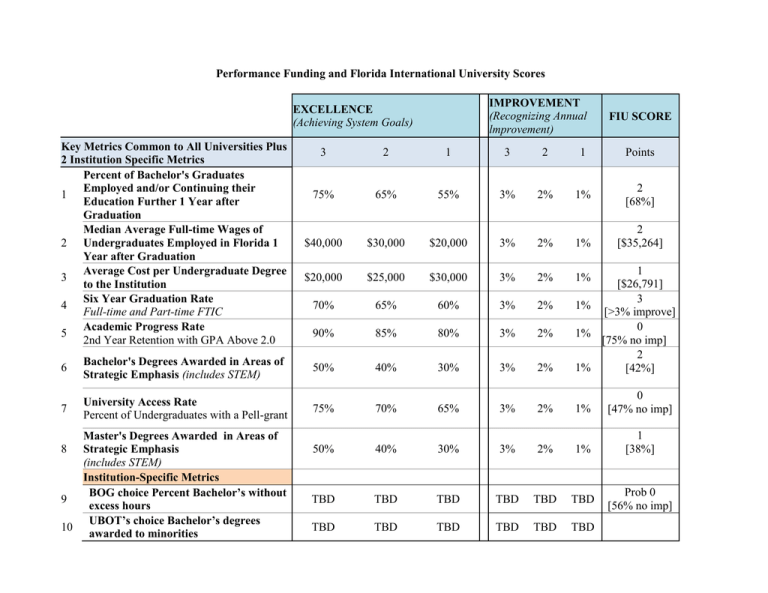
Performance Funding and Florida International University Scores IMPROVEMENT (Recognizing Annual lmprovement) EXCELLENCE (Achieving System Goals) Key Metrics Common to All Universities Plus 2 Institution Specific Metrics Percent of Bachelor's Graduates Employed and/or Continuing their 1 Education Further 1 Year after Graduation Median Average Full-time Wages of 2 Undergraduates Employed in Florida 1 Year after Graduation Average Cost per Undergraduate Degree 3 to the Institution Six Year Graduation Rate 4 Full-time and Part-time FTIC Academic Progress Rate 5 2nd Year Retention with GPA Above 2.0 FIU SCORE 3 2 1 3 2 1 Points 75% 65% 55% 3% 2% 1% 2 [68%] $40,000 $30,000 $20,000 3% 2% 1% $20,000 $25,000 $30,000 3% 2% 1% 70% 65% 60% 3% 2% 90% 85% 80% 3% 2% 2 [$35,264] 6 Bachelor's Degrees Awarded in Areas of Strategic Emphasis (includes STEM) 50% 40% 30% 3% 2% 1 [$26,791] 3 1% [>3% improve] 0 1% [75% no imp] 2 1% [42%] 7 University Access Rate Percent of Undergraduates with a Pell-grant 75% 70% 65% 3% 2% 1% 0 [47% no imp] 50% 40% 30% 3% 2% 1% 1 [38%] TBD TBD TBD TBD TBD TBD TBD TBD TBD TBD TBD TBD Master's Degrees Awarded in Areas of Strategic Emphasis (includes STEM) Institution-Specific Metrics BOG choice Percent Bachelor’s without 9 excess hours UBOT’s choice Bachelor’s degrees 10 awarded to minorities 8 Prob 0 [56% no imp]


