Event Notification ModuleTM
Monitoring and Diagnostics
User Guide
Version 8.2
63220-083-06A2
04/2014
Event Notification Module Monitoring and Diagnostics
63220-083-06A2
04/2014
Notices
StruxureWare and Schneider Electric are either trademarks or registered
trademarks of Schneider Electric in France, the USA, and other countries.
All other trademarks are property of their respective owners.
2
© 2014 Schneider Electric. All Rights Reserved.
63220-083-06A2
04/2014
Safety Information
Important Information
Read these instructions carefully and look at the equipment to become
familiar with the device before trying to install, operate, service or
maintain it. The following special messages may appear throughout
this manual or on the equipment to warn of potential hazards or to call
attention to information that clarifies or simplifies a procedure.
The addition of either symbol to a “Danger” or “Warning” safety label
indicates that an electrical hazard exists which will result in personal injury if
the instructions are not followed.
This is the safety alert symbol. It is used to alert you to potential personal
injury hazards. Obey all safety messages that follow this symbol to avoid
possible injury or death.
DANGER
DANGER indicates an imminently hazardous situation which, if not
avoided, will result in death or serious injury.
WARNING
WARNING indicates a potentially hazardous situation which, if not
avoided, can result in death or serious injury.
CAUTION
CAUTION indicates a potentially hazardous situation which, if not
avoided, can result in minor or moderate injury.
NOTICE, is used to address practices not related to physical injury. The
safety alert symbol shall not be used with this signal word.
Please Note
Electrical equipment should be installed, operated, serviced and maintained
only by qualified personnel. No responsibility is assumed by
Schneider Electric for any consequences arising out of the use of this
material.
A qualified person is one who has skills and knowledge related to the
construction, installation, and operation of electrical equipment and has
received safety training to recognize and avoid the hazards involved.
© 2014 Schneider Electric. All Rights Reserved.
3
Event Notification Module Monitoring and Diagnostics
63220-083-06A2
04/2014
Safety Precautions
WARNING
HAZARD OF INCORRECT INFORMATION
• Do not incorrectly configure the software, as this can lead to incorrect
reports and/or data results.
• Do not base your maintenance or service actions solely on messages
and information displayed by the software.
• Do not rely solely on software messages and reports to determine if the
system is functioning correctly or meeting all applicable standards and
requirements.
• Consider the implications of unanticipated transmission delays or
failures of communications links.
Failure to follow these instructions can result in death, serious
injury, or equipment damage.
4
© 2014 Schneider Electric. All Rights Reserved.
63220-083-06A2
04/2014
Table of Contents
CHAPTER 1 - OVERVIEW
About Monitoring and Diagnostics .............................................................. 7
CHAPTER 2 - EVENT
NOTIFICATION MODULE
MONITORING
Start Event Notification Module Monitoring and Diagnostics ...................... 9
View Monitoring Data .................................................................................. 9
Use Filtering ........................................................................................... 10
Filtering On/Off ...................................................................................... 11
Export to a CSV Formatted File ................................................................ 11
Configure Monitoring Options ................................................................... 11
CHAPTER 3 - EVENT
NOTIFICATION MODULE
DIAGNOSTICS
View Diagnostics Data .............................................................................. 13
Use Filtering ........................................................................................... 14
Filtering On/Off ...................................................................................... 15
Export to a CSV Formatted File ................................................................ 15
Configure Diagnostics Options .................................................................. 15
© 2014 Schneider Electric All Rights Reserved
5
Table of Contents
6
63220-083-06A2
04/2014
© 2014 Schneider Electric All Rights Reserved
63220-083-06A2
04/2014
Chapter 1 — Overview
WARNING
HAZARD OF UNDELIVERED NOTIFICATIONS
Do not rely solely on Event Notification Module software for alarm notifications where
human or equipment safety relies on successfully delivered notifications.
Failure to follow these instructions can result in death, serious injury, or equipment
damage.
NOTE: Other parts of the overall communication system, such as email servers and cellular
phone systems, could fail and result in notifications not being delivered. If notifications are not
delivered to recipients, conditions that cause alarming may persist and result in safety critical
issues.
WARNING
HAZARD OF UNINTENDED OPERATION
Do not use Event Notification Module software for critical control or protection applications
where human or equipment safety relies on the operation of the control circuit.
Failure to follow these instructions can result in death, serious injury, or equipment
damage.
About Monitoring and Diagnostics
This user guide covers the Monitoring and Diagnostics pages of the Event Notification
Module (ENM). Users in all three user groups (ENMAdmin, ENMControl, and ENMUser)
have full access to the tabs in Monitoring and Diagnostics.
For related information on the Event Notification Module and Alarm Sentry, refer to:
•
•
Event Notification Module Configuration Guide, 63220-083-04
Alarm Sentry Configuration Guide, 63220-083-05
© 2014 Schneider Electric All Rights Reserved
7
Chapter 1—Overview
About Monitoring and Diagnostics
8
63220-083-06A2
04/2014
© 2014 Schneider Electric All Rights Reserved
63220-083-06A2
04/2014
Chapter 2 — Event Notification Module Monitoring
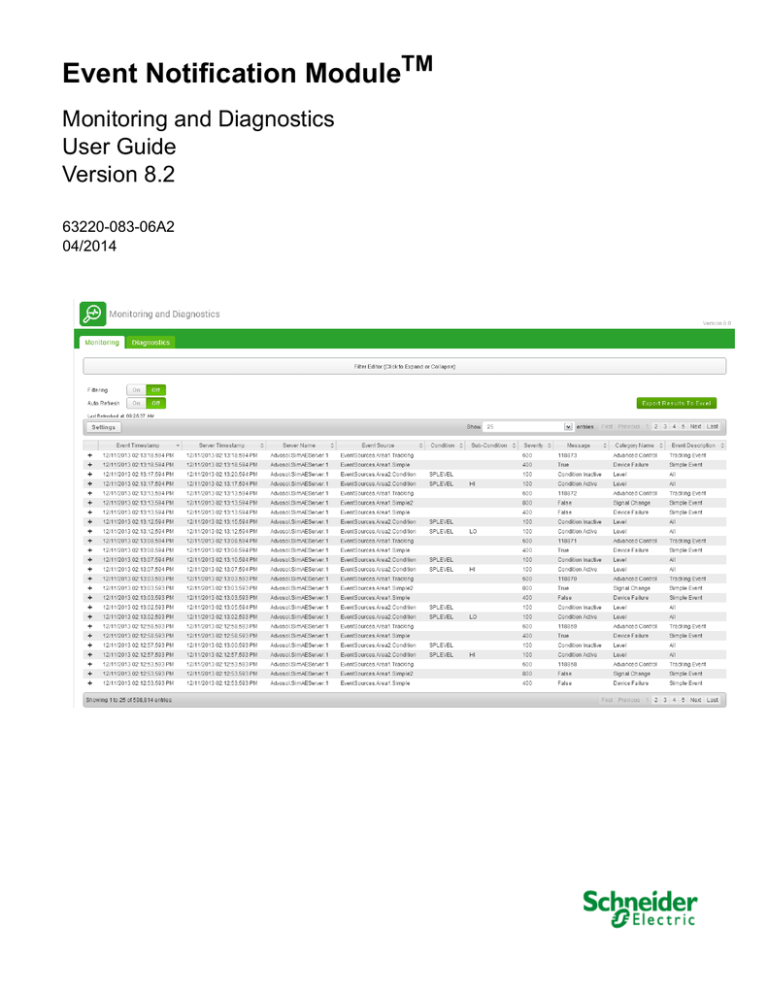
The Monitoring page of Event Notification Module Monitoring and Diagnostics displays live
and historical alarms and events received from the OPC alarm and event servers. You can
set options to display or hide certain event attributes.
Start Event Notification Module Monitoring and Diagnostics
If the Event Notification Module Monitoring and Diagnostics page is not open, then open it as
follows.
In Windows, go to Start > All Programs > Schneider Electric > StruxureWare Solutions >
Monitoring & Diagnostics. You can also use the Desktop shortcut icon.
The Event Notification Module Monitoring and Diagnostics page appears.
View Monitoring Data
In ENM, you can view current monitoring information on the Monitoring page as it happens.
To view custom attributes, click on a record’s +/- sign and custom attribute data expands or
collapses.
You can click a column heading to sort the grid data.
NOTE: ENM refreshes this page every ten seconds when Auto Refresh is on (the
Auto Refresh button is green when on). “Export Results To Excel” and pagination controls are
not available while Auto Refresh is on. Auto Refreshing against all historical records impacts
performance. If you are using Auto Refresh, it is recommended that you apply a filter
condition to only look at recent data (for example, a Timestamp greater than four hours ago).
© 2014 Schneider Electric All Rights Reserved
9
Chapter 2—Event Notification Module Monitoring
View Monitoring Data
63220-083-06A2
04/2014
Use Filtering
With filtering, you can select a condition, such as Equals, Greater Than or Equals, or
Contains and enter a custom filter value. For this example, we are going to filter alarms with a
severity greater than or equal to 700.
1. Click the Filter Editor bar above the grid to display the filter.
2. From the Column drop down, choose Severity; from the Operator drop down, choose
Greater Than or Equals; in Value, enter 700. Click Validate & Apply Filter.
The filtered data appears in the grid.
If needed, you can define a filter in more than one column. To do so, click Add
Condition, set filtering criteria, and click Validate & Apply Filter. The grid displays the
event records where both conditions are true.
You can remove conditions individually or click Remove All Conditions to remove all of
them.
10
© 2014 Schneider Electric All Rights Reserved
63220-083-06A2
04/2014
Chapter 2—Event Notification Module Monitoring
Export to a CSV Formatted File
Filtering On/Off
The Filtering On/Off button allows you to temporarily disable your validated filter conditions.
(Filtering is on when the button is green).
Export to a CSV Formatted File
You can export the data in the grid to a CSV formatted file.
NOTE: “Export Results To Excel” is not available while Auto Refresh is on.
1. Set the conditions to filter the data you want to export.
2. Click Export Results to Excel.
The file is generated on the server and downloaded by your browser.
Configure Monitoring Options
You can select the columns you want to display on the Monitoring page.
1. Click Settings.
© 2014 Schneider Electric All Rights Reserved
11
Chapter 2—Event Notification Module Monitoring
Configure Monitoring Options
63220-083-06A2
04/2014
2. Click the boxes to specify which columns should be visible and which should be hidden.
Faded boxes represent a hidden column. You may also drag the boxes up and down to
change the order of the columns with the topmost box representing the left-most column.
3. Click Apply Changes. If you want to revert to your previous settings, click Discard
Changes.
12
© 2014 Schneider Electric All Rights Reserved
63220-083-06A2
04/2014
Chapter 3 — Event Notification Module Diagnostics
The Diagnostics page of Event Notification Module Monitoring and Diagnostics provides real
time and historical viewing of activity relating to the ENM. It does not provide information on
events transmitted from OPC alarm and event servers. You can set options to display or hide
certain diagnostics data. If the Event Notification Module Monitoring and Diagnostics page is
not open, refer to “Start Event Notification Module Monitoring and Diagnostics” on page 9 to
open it.
View Diagnostics Data
In ENM, you can view current diagnostic information on the Diagnostics page as it happens.
You can click a column heading to sort the grid data.
NOTE: ENM refreshes this page every ten seconds when Auto Refresh is on (the
Auto Refresh button is green when on). “Export Results To Excel” and pagination controls are
not available while Auto Refresh is on. Auto Refreshing against all historical records impacts
performance. If you are using Auto Refresh, it is recommended that you apply a filter
condition to only look at recent data (for example, a Timestamp greater than four hours ago).
© 2014 Schneider Electric All Rights Reserved
13
Chapter 3—Event Notification Module Diagnostics
View Diagnostics Data
63220-083-06A2
04/2014
Use Filtering
With filtering, you can select a condition, such as Equals, Greater Than or Equals, or
Contains and enter a custom filter value. For this example, we are going to filter alarms with a
priority equal to 100.
1. Click the Filter Editor bar above the grid to display the filter.
2. From the Column drop down, choose Priority; from the Operator drop down, choose
Equals; in Value, enter 100. Click Validate & Apply Filter.
The filtered data appears in the grid.
If needed, you can define a filter in more than one column. To do so, click Add
Condition, set filtering criteria, and click Validate & Apply Filter. The grid displays the
event records where both conditions are true.
You can remove conditions individually or click Remove All Conditions to remove all of
them.
14
© 2014 Schneider Electric All Rights Reserved
63220-083-06A2
04/2014
Chapter 3—Event Notification Module Diagnostics
Export to a CSV Formatted File
Filtering On/Off
The Filtering On/Off button allows you to temporarily disable your validated filter conditions.
(Filtering is on when the button is green).
Export to a CSV Formatted File
You can export the data in the grid to a CSV formatted file.
NOTE: “Export Results To Excel” is not available while Auto Refresh is on.
1. Set the conditions to filter the data you want to export.
2. Click Export Results to Excel.
The file is generated on the server and downloaded by your browser.
Configure Diagnostics Options
You can select the columns you want to display on the Diagnostics page.
1. Click Settings.
© 2014 Schneider Electric All Rights Reserved
15
Chapter 3—Event Notification Module Diagnostics
Configure Diagnostics Options
63220-083-06A2
04/2014
2. Click the boxes to specify which columns should be visible and which should be hidden.
Faded boxes represent a hidden column. You may also drag the boxes up and down to
change the order of the columns with the topmost box representing the left-most column.
3. Click Apply Changes. If you want to revert to your previous settings, click Discard
Changes.
16
© 2014 Schneider Electric All Rights Reserved
Event Notification Module 8.2
Monitoring and Diagnostics User Guide
StruxureWare and Schneider Electric are trademarks or registered trademarks of Schneider
Electric in France, the USA and other countries. Other trademarks used are the property of their
respective owners.
This product must be installed, connected and used in compliance with prevailing standards
and/or installation regulations. As standards, specifications and designs change from time to time,
always ask for confirmation of the information given in this publication.
Schneider Electric
35 rue Joseph Monier
92500 Rueil-Malmaison, France
www.schneider-electric.com
63220-083-06A2 04/2014
Replaces 63220-083-06A1 12/2013
© 2014 Schneider Electric. All Rights Reserved


