Edited Gradient-Selected 2D HSQC
advertisement
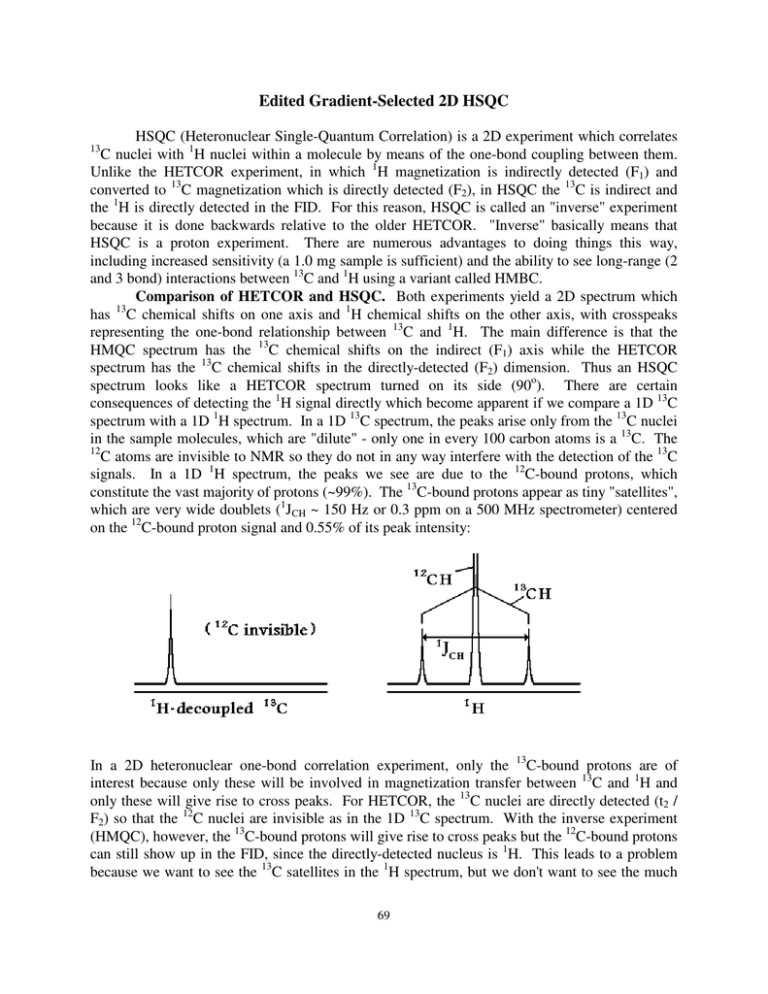
Edited Gradient-Selected 2D HSQC HSQC (Heteronuclear Single-Quantum Correlation) is a 2D experiment which correlates C nuclei with 1H nuclei within a molecule by means of the one-bond coupling between them. Unlike the HETCOR experiment, in which 1H magnetization is indirectly detected (F1) and converted to 13C magnetization which is directly detected (F2), in HSQC the 13C is indirect and the 1H is directly detected in the FID. For this reason, HSQC is called an "inverse" experiment because it is done backwards relative to the older HETCOR. "Inverse" basically means that HSQC is a proton experiment. There are numerous advantages to doing things this way, including increased sensitivity (a 1.0 mg sample is sufficient) and the ability to see long-range (2 and 3 bond) interactions between 13C and 1H using a variant called HMBC. Comparison of HETCOR and HSQC. Both experiments yield a 2D spectrum which has 13C chemical shifts on one axis and 1H chemical shifts on the other axis, with crosspeaks representing the one-bond relationship between 13C and 1H. The main difference is that the HMQC spectrum has the 13C chemical shifts on the indirect (F1) axis while the HETCOR spectrum has the 13C chemical shifts in the directly-detected (F2) dimension. Thus an HSQC spectrum looks like a HETCOR spectrum turned on its side (90o). There are certain consequences of detecting the 1H signal directly which become apparent if we compare a 1D 13C spectrum with a 1D 1H spectrum. In a 1D 13C spectrum, the peaks arise only from the 13C nuclei in the sample molecules, which are "dilute" - only one in every 100 carbon atoms is a 13C. The 12 C atoms are invisible to NMR so they do not in any way interfere with the detection of the 13C signals. In a 1D 1H spectrum, the peaks we see are due to the 12C-bound protons, which constitute the vast majority of protons (~99%). The 13C-bound protons appear as tiny "satellites", which are very wide doublets (1JCH ~ 150 Hz or 0.3 ppm on a 500 MHz spectrometer) centered on the 12C-bound proton signal and 0.55% of its peak intensity: 13 In a 2D heteronuclear one-bond correlation experiment, only the 13C-bound protons are of interest because only these will be involved in magnetization transfer between 13C and 1H and only these will give rise to cross peaks. For HETCOR, the 13C nuclei are directly detected (t2 / F2) so that the 12C nuclei are invisible as in the 1D 13C spectrum. With the inverse experiment (HMQC), however, the 13C-bound protons will give rise to cross peaks but the 12C-bound protons can still show up in the FID, since the directly-detected nucleus is 1H. This leads to a problem because we want to see the 13C satellites in the 1H spectrum, but we don't want to see the much 69 larger (~200X larger) central peak representing the 12C-bound protons. significant differences between HETCOR and the HSQC experiment: This leads to two 1. In HSQC, the cross peaks appear in pairs separated in the F2 (horizontal) dimension by the large one-bond CH coupling (~ 150 Hz) and centered on the 1H chemical shift. This coupling can be eliminated by turning on a 13C decoupler during the acquisition of the FID, which operates just like the 1H decoupler in a 13C-detected experiment. Because the 13C range of chemical shifts is large (~200 ppm), the 13C decoupler has to put out quite a bit of power and this limits the acquisition time (AQ) to a maximum of about 220 ms (0.22 s). Also, by using a longer relaxation delay (D1) of 1.5 s, the amplifiers and the sample have a chance to "cool off" before the next FID is acquired. Acquisition time is reduced simply by acquiring fewer data points. For 13 C decoupled experiments we reduce TD (F2) to 1024 or 512 to get the AQ within the 220 ms limit. 2. At each proton peak position in F2 there will be a vertical streak (parallel to the F1 axis) which represents the 12C-bound proton signal. Because the 12C-bound proton signal is not associated with (correlated to) any 13C chemical shift, it just appears at all F1 frequencies; that is, as a vertical streak. The advent of pulsed field gradients allows us to select the coherence pathway desired and destroy the 12C-H signal by gradient scrambling of the coherence. This leads to excellent suppression of the 12C-H artefact in a single scan. Since we are only observing the 13C-H signal, we can turn up the receiver gain dramatically, increasing selectivity. Furthermore, there is no need for a phase cycle to cancel the 12C-H signal, so we can acquire a 2D HSQC with NS=1, leading to very short time experiments provided there is an adequate concentration of sample (>10 mg for typical organic molecules). For further improvement in pathway selection, or for more dilute samples, you can increase NS to 2 or 4. The HSQC experiment works like this: a 90o proton pulse rotates the 1H magnetization into the x-y plane. This magnetization is converted to 13C magnetization by applying simultaneous 90o pulses on the 13C and 1H channels. The 13C magnetization rotates in the x-y plane during the t1 delay, which has a 180o pulse in the center to cancel the effects of J-coupling to the proton during t1. The 13C magnetization is converted back into 1H magnetization by again applying simultaneous 1H and 13C pulses. Each of these magnetization jumps is due to the onebond J-coupling between 1H and 13C. The proton FID is recorded, with 13C decoupling, for each value of t1 and the complete set of proton FIDs is used to generate the 2D spectrum. Coherence pathway selection in the HSQC can be acheived by using two gradients on either side of the central 180o pulse. This twists the 13C magnetization in the x-y plane depending on the position of the molecule in the sample tube along the z axis. After the magnetization is converted back to 1 H magnetization, a refocusing gradient is applied to undo this twist. The coherence levels in the three gradient periods are +1 (13C single quantum), -1 (13C inverted by the 180o pulse) and -4 (observable 1H single quantum). The total "twist" is thus zero at the end if the magnetization has passed through the desired pathway. For 12C-H, it is not possible to follow this pathway so the final gradient destroys all 1H magnetization. The edited HSQC uses a further trick to invert the CH2 signals, leaving these crosspeaks negative in the 2D spectrum. The CH and CH3 signals should be phased to be positive. 70 2D-HSQC Spectrum. Insert the sample, lock, and run a standard 1D 1H spectrum. Write down the range of chemical shifts desired in the 2D spectrum: for example, from 2.0 to 6.0 ppm. Remember that solvent peaks, impurities, and TMS can be ignored because the digital filter will cut these signals out if they are not within the spectral window. Now calculate O1P as the average of these two values (e.g., (2.0 + 6.0)/2 = 4.0 ppm). This is the center of the F2 spectral window. Calculate SW(F2) as the difference between the values (e.g. 6.0 - 2.0 = 4.0 ppm). this is the width of the spectral window in ppm. Run a 13C spectrum (or look at one you have already run) and write down the desired range of chemical shifts for protonated carbons. Don't count the quaternary carbons since they will not show up in the HSQC spectrum. If you have no idea about the 13C chemical shifts, use a range of 150 ppm to 0 ppm. The average value (e.g. (150 + 0)/2 = 75) will be O2P, the center of the F1 spectral window, and the difference (e.g. 150 - 0 = 150 ppm) will be the SW(F1), the width of the F1 spectral window in ppm. In a new data area, use rpar to get the std-hsqc-dec-ed-n3 parameters. Enter eda and set the four values SW(F2), SW(F1), O1P and O2P. Then check AQ and if it is greater than 0.22 sec reduce TD (F2) by a factor of two. Continue to reduce TD (F2) until the AQ is 0.22 sec or shorter. Set the following: TD(F1) = 512 NS =1 or 2 (for sample with more than 10 mg) AQ_mod = DQD Tune the probe (wobb) for 1H and 13C. Use gs to adjust the receiver gain RG. Check experiment time with expt. Start the experiment with zg. Processing and Plotting. In edp set the following parameters: SI(F2) = 1024 SI(F1) = 512 WDW(F2) = WDW(F1) = QSINE SSB(F2) = SSB(F1) = 2 Transform using xfb and phase correct. Plot the spectrum in color with negative contours red and positive contours black. 71
