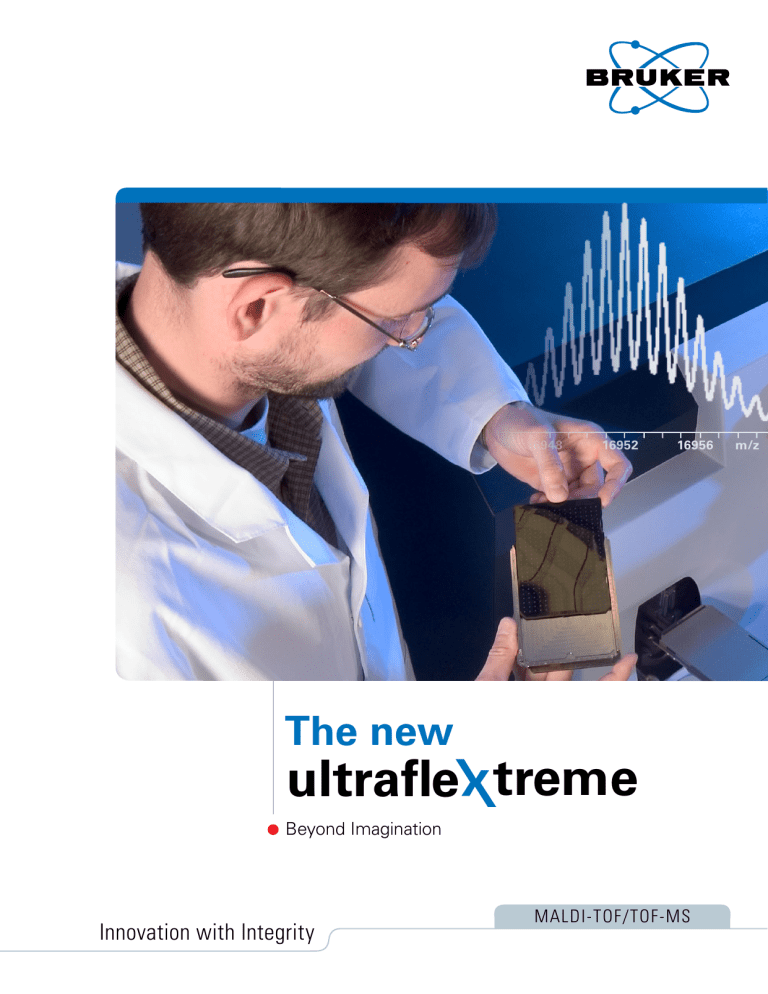
ultrafleXtreme™ brochure

16948 16952 16956 m/z
The new ultrafle treme
Beyond Imagination
MALDI-TOF/TOF-MS
Innovation with Integrity
Explore Your Applications with
MALDI-TOF
The new ultrafleXtreme ™ revolutionizes what you can achieve with a MALDI-TOF and opens new fields for research and industry.
Applications such as in-depth characterization of
Biopharmaceuticals, high speed tissue imaging based biomarker discovery and glycoproteomics extend beyond classical proteomics utilizing a multitude of technology innovations and unique proprietary software.
MALDI Imaging – the complete molecular histology solution from the technology leaders
Top-Down Biomarker Discovery
New Bottom-Up ImageID™ workflow
for protein identification and localization
– even suitable for FFPE tissue and large
proteins
Highly enhanced data acquisition speed
and instrument robustness to perform
large scale studies
BioPharma – intact protein MW determination and direct protein sequencing as never before with
MALDI-TOF
Accurate assignment of intact protein
molecular weights by novel multiple
charge state analysis
Fast and information-rich protein
sequencing
Side product or terminal variant
identification
Characterization of PEGylated proteins
Proteomics and Glycoproteomics
– additional capabilities extending your research scope
Glycoprotein Analysis – the next life science frontier at your finger tips
Integrated workflows for LC-MS/MS
and 2D gels
Quantification with any label or label-free
Top-Down [1] and Bottom-Up workflow
Glycoproteomics: Integrated
GlycoQuest ™ search engine for
automated glycan structure elucidation in
proteins for high-throughput studies
Full glycan analysis
N-Glycopeptide targeting in complex
mixtures
Glycopeptide structure elucidation by
unique MS/MS patterns in MALDI-TOF
and automated glycan database search
with GlycoQuest
MALDI Biotyper – microbial identification for the 21 st century
Bacteria ID
Yeast and fungi ID
MALDI Sepsityper Kit for bacteria and
yeast ID from positive blood culture
bottles within 30 min
More Flexible Than Ever
Accurate Intact Protein Molecular
Weight Analysis – completing the picture for biopharmaceutical characterization
Up to 100x increase of mass
accuracy down to the low ppm range
for intact protein MW determination
due to multiple charged ion signals
Bruker DHAP matrix proven for
Top-Down analysis producing multiple
charged ions
Greater than 30,000 resolution for
intact proteins due to FlashDetector ™
Gold Standard in Top-Down
Protein Sequencing
Monoisotopic sequence readout of up
to 90 residues from N- and C-termini
Automated, rapid protein QC reports
from BioPharma Compass software
Patented T 3 -Sequencing for direct
N- or C-terminal characterization [2]
High Definition MALDI Imaging
Continuing innovation leadership
with patented enabling technologies
from sample preparation to
the molecular histology workflow,
advanced data treatment and auto-
mated tissue classification
Access to FFPE tissue and large
proteins: New proprietary ImageID
workflow provides identities and
localization of ~ 80% of observed
peptides in tissue
2 kHz FlatTop smartbeam-II ™ laser
for non-destructive tissue analysis
permitting seamless correlation with
high resolution histopathology from
the same tissue slice
High definition MALDI Imaging by
industry leading 10 μm laser focus and
true edge-to-edge pixel definition
High spatial resolution for protein
images at best image brightness by
patented smartbeam laser technology
Targeted Protein Quantification with 1-2% CV [4]
HPLC-free MALDI-TOF for highest
assay speed and accuracy
LC-MALDI – the workhorse for proteomics and glycobiology
smartbeam-II laser for acquisition of
maximum number of MS/MS spectra
per fraction
Highest sensitivity through
AnchorChip ™ technology – now with
up to 1536 spots/plate
Market leading mass resolution
(> 40,000) and accuracy (< 1 ppm)
ProteinScape ™ software covering all
proteomics and glycoproteomics
workflows
Direct analysis of glycans and
glycopeptides enabled by GlycoQuest
Read more
[1] Maltmann DJ et al.
Proteomics.
2011;11(20):3992-4006.
[2] Suckau D, Resemann A. Anal Chem.
2003;75(21):5817-24.
[3] Resemann a et al.
Anal Chem.
2010;82(8):3283-92.
[4] Anderson NL et al. J Proteome res.
2012;11(3):1868-78.
Extreme Performance for Bottom-Up
Proteomics
The ultrafleXtreme’s next-generation
MS technologies enable greater proteome coverage than ever before.
The ultrafleXtreme offers unparalleled cutting-edge capabilities for Bottom-Up proteomics at your fingertips.
Bruker’s 25 years Life Science experience and excellent bioinformatics compliant with HUPO/PSI publication guidelines effortlessly converts unrivalled MALDI-
TOF/TOF data into published results.
First-class LC-MALDI results
Identify, quantify and characterize
– all your results in the blink of an eye
ProteinScape software makes it possible to access, process, merge, query and report all Bottom-Up proteomics data from high throughput 2D gel identification to label or label-free LC-MALDI quantification.
5μg HeLa Cell digest resulting in 2890 protein IDs
First-Class LC-MALDI results from even the most complex
Bottom-Up proteomics analysis
5 μg HeLa Cell digest
• 2890 Protein IDs @
1% Peptide FDR
• 11,960 Spectrum matches
• 38% Spectrum ID rate
Providing a perfect complement to ESI protein
ID workflows
First-class LC-MALDI results
Identification, structural characterization and quantification at a glance
ProteinScape – From data to knowledge
Data from various workflows
(multiple digest enzymes, label or
label-free quantification, ESI or MALDI)
can be merged into confident,
non-redundant protein information
Just a few mouse clicks to compare
results across multiple studies
Direct access to web resources relates
information such as gene ontology or
mapping of PTMs on the 3D protein
structure
Cross the Next Frontier –
Glycoproteomics Expertise Delivered
Get the full picture
The ultrafleXtreme TOF/TOF spectra of N-glycopeptides contain both peptide and glycan information. ProteinScape uses a TOF/TOF specific signature fragmentation pattern generated by intra-ring cleavage of the peptide-binding sugar to assign the aglycone and the glycan molecular weights and triggers their identification in parallel database searches.
The specific signature enables the classification and filtering of glycopeptides from non-glycosylated ones in complex cell lysates. ProteinScape integrates the GlycoQuest search engine for glycan structure DB searches.
Glycopeptide region
LC-MALDI analysis of a human antibody digest, shows at the first glance the separated glycopeptide region on the MS-level.
Peptide mo ie ty
Glycopeptide specific intra-ring cleavage pattern
Glycan moi e ty
Automated glycopeptide detection by ProteinScape. Signature ion pattern provides molecular weights for both the peptide and glycan from a single glycopeptide TOF/TOF spectrum. Structures from both moieties are assigned in this spectrum.
Classifier
Representation of an ultrafleXtreme glycoprotein analysis in Protein-
Scape. All glycopeptides were detected in the
LC-MS/MS dataset and the glycan were searched using GlycoQuest.
A structure candidate is shown as structure and its fragments annotated to a matching MALDI-TOF/
TOF spectrum permitting manual inspection whenever requested.
GlycoQuest identified glycans
Merge
Glycopeptide structures
10,000 MS/MS Spectra
Mascot identified peptides
Bruker’s ProteinScape software detects glycopeptide-specific fragmentation patterns in MALDI-TOF/TOF spectra that allows a separate glycane database search with GlycoQuest to ID the glycane part and a Mascot search to ID the peptide part. ProteinScape can then visualize both results to merge the information on the glycopeptide level.
From Tissue Biomarker Discovery...
MALDI Imaging is emerging into an indispensable discovery tool for molecular tissue and histopathological research, reaching out from high resolution imaging tools to statistical cohort analysis and biomarker discovery and identification.
Brukers MALDI Molecular Imager solution enables robust and quality-controlled tissue preparations, and links the classical histopathology workflow with the molecular dimension. Unique, patented software and techniques for clinical studies enable powerful biomarker discovery.
The ultrafleXtreme is an essential element in any imaging project.
Rat testis at 20 μm spatial resolution
See how this feature
allows interactive exploration
of histology and molecular
information at
http://www.youtube.com/
watch?v=YV2wzVXEvqg?
hd=1
2
1
MALDI image of rat testis at 20 μm spatial resolution.
Two molecular signals that highlight different features are selected.
Bruker flexImaging software allows cross-fading between the MALDI image and the superimposed virtual slide.
At higher resolution, histological features become visible in the virtual slide image.
Full resolution reveals
(1) a capillary vessel
(2) nuclei of mature spermatids and demonstrates correlation of histological features and molecular signals.
Virtual microscopy
Digital microscopy enables detailed evaluation of highresolution histological images on a computer screen.
The alignment of MALDI Imaging data with other images (e.g. histological stains) is crucial for the interpretation of results.
Bruker’s proprietary solution for virtual microscopy allows co-registration of multiple image modalities with unparalleled ease.
Patient Samples
Group 1
Group 2
Histology MALDI Images
Statistical Analysis
Annotation
Inflammation
Tumor
Connective Tissue
Group 1 Group 2
Biomarker
From beautiful pictures to true biomarker discovery – MALDI Imaging is perfectly suited to analyze biomarkers in tissue samples. Bruker’s unique suite of software tools supports the entire workflow, including statistical analysis.
Comprehensive bioinformatic tools for statistical analysis of MALDI Imaging data, such as hierarchical clustering,
PCA or pLSA allow researchers to mine data efficiently.
... To Identification and Validation
MALDI Imaging covers a multitude of application areas ranging from clinical samples to plant material and animal tissue
A B C
A: Human bladder cancer specimen; B: Barley seed; C: Rat testis
Identification of biomarker candidates are essential for validating results and the translation of MALDI Imaging derived biomarkers to subsequent clinical stages, such as treatment prognosis or survival prediction. Top-Down discovery and identification has been demonstrated successfully*.
As well, higher MW protein detection and analysis of formalin-fixed tissues are now enabled by the novel ImageID workflow. In this Bottom-Up workflow highly resolved images from on-tissue digests are merged with classical LC-MS/MS identification.
*References:
Lemaire 2007 Regɑ
2, Hanrieder 2011
S100-A10, Hardesty 2011 S100-A6, Nipp
2011 S100-A6/10, Meistermann 2006 TrT,
Rauser 2010 CRIP1, Lagarrigue 2011
Thym β , LCFA-CoA
Peptide Identification by LC-MALDI
Elute
LC-MALDI
In situ digest
Peptide Localization by MALDI-Imaging
Matrix
MALDI-Image
Protein ID
Protein and peptide list
Protein filter list
Consecutive sections are processed in parallel to provide both protein distribution and identification simultaneously.
A tryptic digest is performed maintaining the resolution of protein distributions. Peptide imaging (right) and LC-MALDI-
MS/MS (left) yield protein and peptide IDs that is software merged for visualization of protein distribution. 80% of all peptides visible in the images can thus be identified and turned into protein localization of more than 100 proteins per image.
ImageID Results
ImageID results from mouse brain
Increased confidence in peptide identifications: Peptides derived from the same protein show the same spatial distribution.
Top-Down Imaging MW range
Bottom-Up Imaging MW range by ImageID workflow
Bottom-Up Imaging with the ImageID workflow extends the mass range of detectable proteins from approx.
25 kDa to greater 100 kDa and grants access to proteins cross-linked by formalin fixation.
Biopharmaceutical Characterization
Ultra rapid product confimation of 150 kDa (MOPC21) antibody
Peptide Mass Fingerprints confirm product identity in 5 seconds without LC-separation
Confident characterization at 1 ppm mass accuracy
> 40,000 resolution
Immediate visualization and automated reporting
5 second analysis
Light Chain = 83.9% Sequence Coverage
Heavy Chain = 60.7% Sequence Coverage
• Tryptic digest of MOPC21 IgG
• Ultra fast product confirmation
Rapid combination of data from multiple digests & instruments in 3 clicks in ProteinScape for ultimate sequence coverage. BioPharma Compass software – Fully automated acquisition, processing and reporting of data.
Batch report view for automated QC PMF
Sequence coverage acceptance criteria can be altered by user depending on desired result.
Intact Molecular Weight Analysis
Intact Myoglobin (17 kDa)
• Isotopic resolution up to 30 kDa
5 second acquisition
Intact molecular weight analysis confirms presence of product and/or contaminants in 5 seconds.
High accuracy MW determination of CA based on double charged ions
• < 15 ppm mass accuracy for intact proteins
• Using multiple charged ions
• Generated in DHAP matrix
Full resolution @ full sensitivity with high mass accuracy is unique to Bruker MALDI-TOF.
N/C-Terminal Sequencing
MALDI Top-Down N/C-terminal Sequencing
1 minute acquisition $ 0.10 Cost
TDS of reduced Light Chain Intact TDS of reduced Heavy Chain Intact
Top-Down sequencing delivers N/C-terminal sequence information in 1 minute without proteolytic digestion. Terminal modifications can be confirmed with an additional Bruker-patented T 3 -Sequencing step.
Characterization information generated by TDS for IgG
Glycan heterogeneity observed at intact level
> 140 amino acid residues confirmed for
light & heavy chain
N/C-termini identified
N-terminal pyro-Glu detected
C-terminal Lys deletion detected
Isotopically resolved TDS data = characterization certainty
Automated acquisition & reporting of data
Technical Specifications
Redefining MALDI-TOF/TOF
Performance
2 kHz smartbeam-II ™ laser technology
enables ultra-high data acquisition
speed
Laser focus diameters down to 10 μm
for high spatial resolution imaging
without pixel overlap
Wide mass range resolution up
to 40,000 due to proprietary PAN ™
technology delivers:
Low ppm accuracy for protein
MW determination
Long and reliable Top-Down
sequence readout, at
monoisotopic resolution
Patented AnchorChip ™ technology
for unmatched consistency and
sensitivity levels
FlashDetector ™ provides 1 ppm
mass accuracy for highest confidence
MALDI Perpetual ™ Ion Source with
entirely automated self-cleaning
in < 15 minutes using a patented
IR-laser process.
Bruker DHAP matrix proven for
Top-Down analysis
Optional bioinformatics packages
BioPharma Compass for
comprehensive Biopharmaceutical
characterization and QC
flexImaging ™ , the leading MALDI
Imaging platform – now with enhanced
data compression for larger scale
studies
ProteinScape™ for the full execution
of proteomics projects featuring
GlycoQuest ™ search engine
for glycoproteomics
Cutting-edge tools for protein analysis
and Top-Down Sequencing
PolyTools ™ : Interactive interpretation of
MALDI polymer spectra
Support of a wide variety of external
software tools and data export
functionality
Support features
Comprehensive self diagnostics and
software update checks
Remote on-line service and support
capability
Compass Security Pack ™ : Assisting in
21CFR part 11 compliance
IQ/OQ/PV procedures for regulated
environments
Maintenance contracts available at
various levels
For research use only. Not for use in diagnostic procedures.
Bruker Daltonik GmbH
Bremen · Germany
Phone +49 (0)421-2205-0
Fax +49 (0)421-2205-103 sales@bdal.de
Bruker Daltonics Inc.
Billerica, MA · USA Fremont, CA · USA
Phone +1 (978) 663-3660 Phone +1 (510) 683-4300
Fax +1 (978) 667-5993 Fax +1 (510) 490-6586 ms-sales@bdal.com ms-sales@bdal.com
www.bruker.com/ultraflextreme


