An Evaluation of Sag Detection Techniques for Fast Solid
advertisement

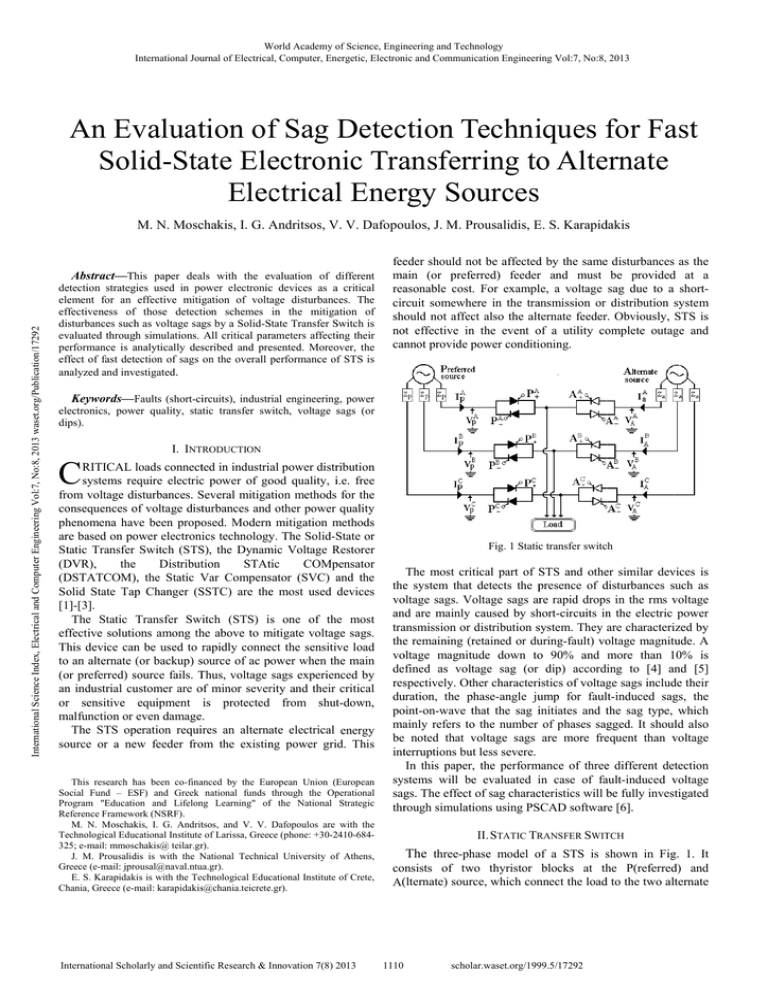
World Academy of Science, Engineering and Technology International Journal of Electrical, Computer, Energetic, Electronic and Communication Engineering Vol:7, No:8, 2013 An Evvaluattion off Sag Detecction Techni T iques for f Faast Sollid-Staate Eleectronnic Traansferrring too Alteernate Elecctricall Enerrgy Soources M. N. Moscchakis, I. G. Andritsos, A V V. Dafopouulos, J. M. Prousalidis, V. P E E. S. Karapiddakis International Science Index, Electrical and Computer Engineering Vol:7, No:8, 2013 waset.org/Publication/17292 Abstract—Thhis paper deaals with the evaluation e of different d deetection strateggies used in poower electronicc devices as a critical eleement for an effective mitiggation of voltage disturbancces. The efffectiveness off those detecttion schemes in the mitigaation of disturbances suchh as voltage saggs by a Solid-S State Transfer Switch S is evvaluated througgh simulations. All critical parrameters affectiing their peerformance is analytically a desscribed and preesented. Moreoover, the efffect of fast dettection of sags on the overall performance off STS is annalyzed and invvestigated. feeeder should not be affectedd by the samee disturbances as the maain (or prefe ferred) feederr and must be provided d at a reaasonable costt. For examplle, a voltage sag due to a shortcirrcuit somewhere in the traansmission or distribution system shoould not affecct also the altternate feederr. Obviously, STS is noot effective inn the event oof a utility coomplete outag ge and cannnot provide power p conditiioning. Keywords—Faults F (short-ciircuits), industrrial engineeringg, power eleectronics, pow wer quality, staatic transfer sw witch, voltage sags s (or dips). C I. INTRODUCTION RITICAL loads connectted in industrial power distrribution i free systems reequire electricc power of goood quality, i.e. froom voltage diisturbances. S Several mitigaation methods for the coonsequences of o voltage distturbances andd other power quality phhenomena havve been propoosed. Modernn mitigation methods m arre based on poower electroniics technologyy. The Solid-S State or Sttatic Transfer Switch (STS S), the Dynam mic Voltage Restorer R (D DVR), thee Distributtion STAttic COMppensator (D DSTATCOM)), the Static V Var Compenssator (SVC) and a the Soolid State Tapp Changer (S SSTC) are thee most used devices [11]-[3]. The Static Transfer Swiitch (STS) is one of the most efffective solutions among thhe above to mitigate m voltagge sags. Thhis device cann be used to rrapidly conneect the sensitivve load too an alternate (or backup) source s of ac power p when thhe main (oor preferred) source s fails. Thus, T voltage sags experiennced by ann industrial cuustomer are oof minor severrity and their critical orr sensitive equipment is protectedd from shutt-down, m malfunction or even damage. The STS opperation requires an alternaate electrical energy soource or a neew feeder froom the existinng power grid. This This research has h been co-finaanced by the Eu uropean Union (E European Soocial Fund – ES SF) and Greek national funds through the Opperational Prrogram "Education and Lifelonng Learning" off the National Strategic Reeference Framework (NSRF). M. N. Moschak kis, I. G. Andrittsos, and V. V. Dafopoulos are with the Teechnological Educational Institute of Larissa, Greecce (phone: +30-22410-6843225; e-mail: mmoscchakis@ teilar.grr). J. M. Prousaliddis is with the N National Techniccal University off Athens, Grreece (e-mail: jprrousal@naval.ntuua.gr). E. S. Karapidak kis is with the Technological Educcational Institute of Crete, Chhania, Greece (e-m mail: karapidakiss@chania.teicretee.gr). International Scholarly and Scientific Research & Innovation 7(8) 2013 Fig. 1 Staticc transfer switcch The most criitical part of STS S and otheer similar dev vices is thee system thatt detects the ppresence of disturbances d such s as vooltage sags. Voltage V sags arre rapid dropss in the rms voltage v annd are mainly caused by shhort-circuits in n the electric power traansmission or distribution ssystem. They are characteriized by thee remaining (rretained or duuring-fault) vooltage magnittude. A vooltage magnittude down too 90% and more than 10% 1 is defined as volttage sag (or dip) accordiing to [4] and a [5] ge sags includde their resspectively. Otther characteriistics of voltag duuration, the phase-angle p juump for faullt-induced saggs, the pooint-on-wave that t the sag iinitiates and the t sag type, which maainly refers too the number of phases sag gged. It should also be noted that voltage v sags are more freequent than voltage v intterruptions buut less severe. In this paperr, the perform mance of threee different deetection sysstems will bee evaluated iin case of faault-induced voltage v saggs. The effect of sag characcteristics will be b fully investigated thrrough simulations using PS SCAD softwarre [6]. II. STATIC TR RANSFER SWIT TCH The three-phhase model oof a STS is shown s in Fig g. 1. It consists of tw wo thyristor blocks at th he P(referredd) and A((lternate) sourrce, which connnect the loadd to the two allternate 1110 scholar.waset.org/1999.5/17292 World Academy of Science, Engineering and Technology International Journal of Electrical, Computer, Energetic, Electronic and Communication Engineering Vol:7, No:8, 2013 so ources. Each thyristor blocck is composeed of three th hyristor m modules corressponding to th he three phasses of the system. In eaach thyristor module, twoo sets of thy yristor switch hes are co onnected in op pposite directtions, e.g. P+A/P-A and A+A/A / -A, to alllow the load current to flo ow in both positive p and negative n diirections. Thee main parts of o STS are: the t voltage deetection sy ystem and thee control systeem that provid des the comm mutation an nd gating of th hyristors. International Science Index, Electrical and Computer Engineering Vol:7, No:8, 2013 waset.org/Publication/17292 III. VOLTAG GE SAG DETEC CTION Voltage sagss have differeent characteristics that dep pend on th heir source. Voltage magnittude and phasse-angle jump p during faault-induced saags are the mo ost common factors f that afffect sag deetection proceedure. Two m more characterristics of sagss affect th heir detection procedure: p 1)) The during g-sag rate of change of vo oltage. Voltag ge sags can be disttinguished in fast f and slow events depend ding on their causee. Fast and shharp sags are usually u due to o shortcircuits or sudden loadd variations while w slow an nd mild sags are maainly due to thhe presence off induction mo otors. 2)) The point--on-wave thatt the sag initiiates. It takes values between 0 and 1800. In n Fig. 2, an example of a faultoltage sag is shown s and th he point-on-waave sag induced vo initiates, which w is also o the time in nstant that th he fault occurs. Mo oreover, the ssubsequent ph hase-angle jum mp due to the faultt can be observ ved. Vpp = (V Vpd ) 2 + (Vpq ) 2 (1) The detection n system struucture is show wn in Fig. 3 (a). A filtter is required d to limit the waving. Morreover, a smaall time delay td is necessary as voltaage Vpp respoonds very rappidly to vooltage variations and may ggive a false detection signaal. Due to this delay, th he voltage varriation should d last at least a time period equal to td in order to ggenerate the detection d signaal. B. 2nd Detectiion Techniquee-Fast Fourierr Transformattion This techniqu ue is based on o the compaarison between n each ~Α ~B ~C phhase voltage Vp (t) , Vp (t) and Vp (t) ( (Fig. 1) with a refference wavefform of constant amplitud de and frequeency as sho own in Fig. 3 (b). Thiss waveform is implementted by callculating the angle of thhe three phaase voltages of the preevious time period (ccycle) using a Fast Fourier F Trransformation (FFT). Baseed on this angle, a a sinu usoidal waaveform is crreated of a 1 pu amplitu ude and of nominal freequency (e.g. 50 Hz) per phase, that is, three new refference waaveforms ~ ~ Vp,ΑFFT (t) , Vp,B FFT (t) an nd ~ Vp,C FFT (t)) are im mplemented. The T maximum m deviation off the three refference (FF FT) waveform ms from the actual ones is compared d to a tollerance of 0.1 or 0.15 pu. A time delay is again requ uired to avoid false deetection signaals due to waveform w disstortion used e.g. by voltage v harmonnics or notchiing. cau C. 3rd Detection Techniquee-Minimum rm ms Voltage This techniqu ue is based onn the calculatiion of the min nimum ~Α ~B rm ms value amon ng the three phhase voltages Vp (t) , Vp (t) ( and ~ w correspo onds to VpC (t) (Fig. 1)) of the preferrred source, which Fig.. 2 Point-on-waave and phase-aangle jump The detection time of voltage sag gs depends on its ch haracteristics and a the detecttion techniquee used. In thiss paper, w focus on the we t fault-induuced sags as faults are th he most frequent type of sags. T Three detectiion techniqu ues are ompared thro ough simulattions using PSCAD sim mulation co so oftware [6]. The T basic prin nciple of those techniquess is the co omparison of the voltage ddeviation from m a reference voltage fo or a tolerance limit. l A refereence value of 1 pu is assum med and, ass tolerance lim mits, values off 0.1 or 0.15 pu can be used d for the vo oltage detectio on system of a Static Transffer Switch. A. 1st Detectiion Techniquee-Park (dqo) Transformatio T on One techniq que commonlly mentioned d and used for the deetection of fast voltage varriations is thee Park or abcc-to-dqo traansformation [7], [10]. The T detection n is based on the caalculation of Vpp according to the followiing equation: International Scholarly and Scientific Research & Innovation 7(8) 2013 thee definition off sag magnitude. A filter is required in order o to red duce the wav ving in the rm ms meters. Th he deviation of that miinimum refereence value is ccompared to th he tolerance limit l as sho own in Fig. 3 (c). When tthis limit is violated, v the trransfer pro ocedure to thee alternate souurce is activateed. D. Simulationn Results The comparisson among the three detecttion methods will w be baased on the saag type and m magnitude, and d the point-on n-wave o Only y faultthaat the sag iss initiated (orr the fault occurs). ind duced sags will be consideered. Sag typee correspondss to the nuumber of phasses sagged. Thhus, in one-ph hase (1ph) sag gs only onne phase is sagged, in two--phase (2ph) sags s two phasses are sag gged and in three-phase t (3 3ph) sags all the t three phasses are sag gged. Moreover, th hree sag magnnitudes (remaiining or durin ng-fault vooltage) are con nsidered: 0.5, 0.6 and 0.7 pu. p For the point-onwaave, ten valuees are used in the range 0-1800, thus in steps of 1880. Tolerance limits of 0.1 or 0.15 pu are studied, that t is, ow 0.9 pu, which whhen the refeerence voltagge goes belo corresponds to the definitionn of sag magn nitude, and 0..85 pu. Th hose two limitts are commonly used in th he literature fo or STS appplications [7]--[9]. 1111 scholar.waset.org/1999.5/17292 World Academy of Science, Engineering and Technology International Journal of Electrical, Computer, Energetic, Electronic and Communication Engineering Vol:7, No:8, 2013 ~ VpΑ (t) ~ VκB (t) ~ VκC (t) Vpd Transformation ABC / dq Vpq X2 p Vp + Filter X + X2 Tolerance _ + Delay t d Comparator Reference value (a) ~ VpΑ (t) FFT φ SIN (Ampitude: 1.0 pu, Frequency: 50 Hz) _ + ~Α Vp, FFT (t) _ International Science Index, Electrical and Computer Engineering Vol:7, No:8, 2013 waset.org/Publication/17292 ~ VpB (t) FFT φ |X| SIN (Ampitude: 1.0 pu, Frequency: 50 Hz) |X| + FFT φ SIN (Ampitude: 1.0 pu, Frequency: 50 Hz) Max ΔVpFFT Comparator Delay t d ~B Vp, FFT (t) _ ~ VpC (t) Tolerance + |X| ~C Vp, FFT (t) (b) ~ VpΑ (t) RMS ~ VpB (t) RMS ~ VpC (t) RMS Tolerance Filter Min _ + Comparator Reference value (c) Fig. 3 Detection schemes based on: (a) Park transformation, (b) Fast Fourier Transformation, (c) Minimum rms voltage The detection time in each case is calculated by repetitive simulations in PSCAD software using the multirun module [6]. The sag type influences the detection time, that is, 3ph sags are expected to be detected faster than 1ph sags for the same sag magnitude and point-on-wave. Furthermore, a high sag magnitude (shallow voltage sag) is expected to give a longer detection time. However, the effect of the point-onwave on the detection time cannot be safely predicted from the beginning, therefore simulations are required. Fig. 4 (a) presents the results for the detection time versus the point-on-wave for three sag magnitudes when the 1st technique is used. A second order filter is used for the 100 Hz frequency with a damping ratio of 0.1 and a time delay td = 2 ms. It can be seen in Fig. 4 (a) that for 1ph and 2ph sags, the detection time is not constant and takes minimum or maximum values in specific ranges of the point-on-wave values. On the other hand, 3ph sags result in a fast and constant detection of 2 ms, which is also the time delay used. Moreover, the detection time becomes considerably longer for higher sag magnitudes only in cases of 1ph sags. In Fig. 4 (b), the simulation results for the 2nd technique are presented. A time delay of 5 ms is used to avoid false signals due to phase-angle jump and significant waveform distortion. International Scholarly and Scientific Research & Innovation 7(8) 2013 It can be seen that this technique gives similar characteristics as regard the effects of sag type and magnitude on the detection time. Again, 1ph and 2ph sags give variable detection times and 3ph sags give a constant value equal to the time delay used. In Fig. 5, the simulation results are presented for the 3rd detection technique. Specifically, the first and the third column of graphs present the detection time and the other columns the transfer time, which will be discussed in the next Section. It can be seen that there are similar characteristics with the other detection techniques as 1ph and 2ph sags give variable detection times, and 3ph sags almost constant values. The only difference from the other techniques is that the detection is clearly and considerably increased as the sag magnitude increases. IV. TRANSFER PROCEDURE Apart from the detection system, the control system of a Static Transfer Switch contains a system that controls the transfer procedure from the one source to the other. This system takes as inputs the three phase voltages and currents of both the preferred and alternate power sources and generates the appropriate sequence of gating pulses for the thyristors. 1112 scholar.waset.org/1999.5/17292 World Academy of Science, Engineering and Technology International Journal of Electrical, Computer, Energetic, Electronic and Communication Engineering Vol:7, No:8, 2013 International Science Index, Electrical and Computer Engineering Vol:7, No:8, 2013 waset.org/Publication/17292 (a) (b) (c) st Fig. 4 Detection time under different sag magnitudes for the 1 and the 2nd Detection Technique: (a) 1ph sags, (b) 2ph sags, (c) 3ph sags The control logic of the transfer procedure for an STS model is analytically described in [8], [9]. Full details are given for the developed STS model and the conditions for a fast and safe transfer to the alternate source. This model is designed to operate for all sag types and point-on-wave, for a load power factor in the range 0.85-1 and phase displacement between the two power sources of ±400. A. Transfer versus Detection Time Transfer time is the time from the detection of voltage sag (or other disturbances) to the completion of transfer for all three phases of the preferred source. It becomes obvious by the previous analysis that fast sag detection will probably lead to a fast completion of the transfer procedure. This is mainly due to the fact that if the detection time is short, the remaining phase voltages of the preferred source will be smaller than the corresponding phase voltages of the alternate source. Thus, the thyristors can be turned off faster applying a reverse biased strategy instead of a zero-crossing detection [7]-[9]. International Scholarly and Scientific Research & Innovation 7(8) 2013 In general, transfer time is not constant and depends on several factors. Some of them include the detection and transfer strategy, the sag type, magnitude, rate-of-change and point-on-wave, the phase-angle jump for fault-induced sags, the instant voltage magnitude of the alternate source at the transfer initiation, and the load’s power factor. In Fig. 5, the transfer time is compared with the detection time received with the 3rd technique, that is, the minimum rms phase voltage calculation. Similarly with the previous comparisons presented in Fig. 4, transfer and detection time is calculated through simulations in PSCAD with relation to the sag’s point-on-wave for 1ph, 2ph and 3ph fault-induced sags. Again, three sag magnitudes and two tolerance limits are considered. Load power factor is assumed to be 0.9, and alternate source’s rms voltage equals to 1 pu. Moreover, each transfer time shown in Fig. 5 is the maximum among the values taken for all the phase displacements between the two power sources in the range of ±400 with 100 steps. 1113 scholar.waset.org/1999.5/17292 World Academy of Science, Engineering and Technology International Journal of Electrical, Computer, Energetic, Electronic and Communication Engineering Vol:7, No:8, 2013 International Science Index, Electrical and Computer Engineering Vol:7, No:8, 2013 waset.org/Publication/17292 (a) (b) (c) rd Fig. 5 Detection and Transfer time for the 3 Detection Technique: (a) 1ph sags, (b) 2ph sags, (c) 3ph sags Transfer time shown in Fig. 5 is the time after the sag detection. It can be observed in Fig. 5 that transfer time does not follow a similar pattern as the detection time. Specifically, higher values can be taken for sags with lower magnitude (larger depth) in some cases. However, the performance of STS models is normally characterized by the total transfer time for the transfer completion, that is, the summation of the detection and the transfer time. In Table I, the minimum, maximum and average values of the total transfer time is presented for each tolerance limit (0.1 and 0.15 pu) and sag magnitude (0.5, 0.6 and 0.7 pu) as calculated by simulations. It can be seen that the total transfer time is less than 20 ms even for a 0.15 pu tolerance limit, that is, the transfer procedure is completed within a cycle at 50 Hz power systems. TABLE I TOTAL TRANSFER TIME STATISTICAL VALUES Tolerance 0.1 pu (ms) Tolerance 0.15 pu (ms) Minimum 3.43 5.5 Average 8.84 11.49 Maximum 16.77 18.86 International Scholarly and Scientific Research & Innovation 7(8) 2013 B. STS Performance In Fig. 6, the STS performance is presented in case of a 1ph sag on phase A. Fig. 6 (a) depicts the sag experienced by the load with and without STS for the most sagged phase. It can be observed that the voltage drops to the same value regardless of STS presence but it lasts much shorter with the presence of STS. In case of R-L load, the sag duration is also the time until the transfer initiation to the alternate source, which is activated by the triggering of the alternate source’s thyristors. Moreover, the transfer procedure for each phase is shown in Fig. 6 (b). The transfer procedure for phases B and C starts later than phase A and at the moment that current flowing through them becomes zero for the first time after the sag is detected. Furthermore, the STS performance in case of a 3ph sag is shown in Fig. 7. Fig. 7 (a) shows the sag experienced by the load with and without STS. Similarly with the previous case, the voltage drops at the same value regardless of the STS presence but lasts much less when STS is present. In Fig. 7 (b), the transfer procedure is depicted for each phase. It should be noted that sag detection does not always coincides with transfer initiation because some conditions should be fulfilled 1114 scholar.waset.org/1999.5/17292 World Academy of Science, Engineering and Technology International Journal of Electrical, Computer, Energetic, Electronic and Communication Engineering Vol:7, No:8, 2013 before transfer initiation is activated, as shown in Figs. 6 and 7. V. CONCLUSION International Science Index, Electrical and Computer Engineering Vol:7, No:8, 2013 waset.org/Publication/17292 In this paper, three detection techniques are developed and compared using simulations. The detection time is proved to be affected by the sag characteristics such as the type, the magnitude and the point-on-wave that sag initiates. The effect of fast sag detection on the transfer time is validated for a proposed STS model. The transfer procedure for two sag types and the reduced sag magnitude experienced by the load due to STS operation is presented and analyzed. (a) (b) Fig. 7 STS performance for a 3ph sag (a) Sag experienced by the load with and without STS (b) Transfer procedure per phase × Fault occurrence ► Sag detection ○ Transfer initiation ● Transfer completion REFERENCES [1] (b) Fig. 6 STS performance for a 1ph sag (a) Sag experienced by the load with and without STS (b) Transfer procedure per phase × Fault occurrence ► Sag detection ○ Transfer initiation ● Transfer completion S. S. Deswal, R. Dahiya, and D. K. Jain, “Application of Boost Converter For Ride-through Capability of Adjustable Speed Drives During Sag and Swell Conditions”, World Academy of Science, Engineering and Technology, Issue 23, November 2008. [2] H. Nasiraghdam, and A. Jalilian, “Balanced and Unbalanced Voltage Sag Mitigation Using DSTATCOM with Linear and Nonlinear Loads”, World Academy of Science, Engineering and Technology, Issue 4, April 2007. [3] Μ. Bollen, Understanding Power Quality Problems: Voltage Sags and Interruptions, Anderson P.M., 2000, pp. 190-198. [4] ΙΕΕΕ 1159 Standard, Recommended Practice for Monitoring Electric Power Quality, 1995. [5] IEC EN 50160 Standard, Voltage characteristics of electricity supplied by public electricity distribution networks, November 1994. [6] Manitoba HVDC Research Center, PSCAD-Power Systems Simulation Software, Version 4.2, Canada, 2004. [7] H. Mokhtari, S. Dewan, and M. Iravani., “Transient Behavior of Load Transformer During Subcycle Bus Transfer”, IEEE Trans. Power Delivery, vol. 18, pp. 1342-1349, October 2003. [8] M. Moschakis, and N. Hatziargyriou, “A Detailed Model for a Thyristor Based Static Transfer Switch”, IEEE Transactions on Power Delivery, vol. 18, no. 4, pp. 1442-1449, October 2003. [9] M. Moschakis, J. Prousalidis, and N. Hatziargyriou, “Performance Assessment of STS used for Alternative Naval Power Supplying Units”, IASME Transactions, Issue 2, Vol. 1, pp. 394-399, April 2004. [10] J. Grainger, and W. Stevenson, Power System Analysis, McGraw-Hill, 1994. (a) International Scholarly and Scientific Research & Innovation 7(8) 2013 1115 scholar.waset.org/1999.5/17292


