Integrated optical refractometer based on U
advertisement
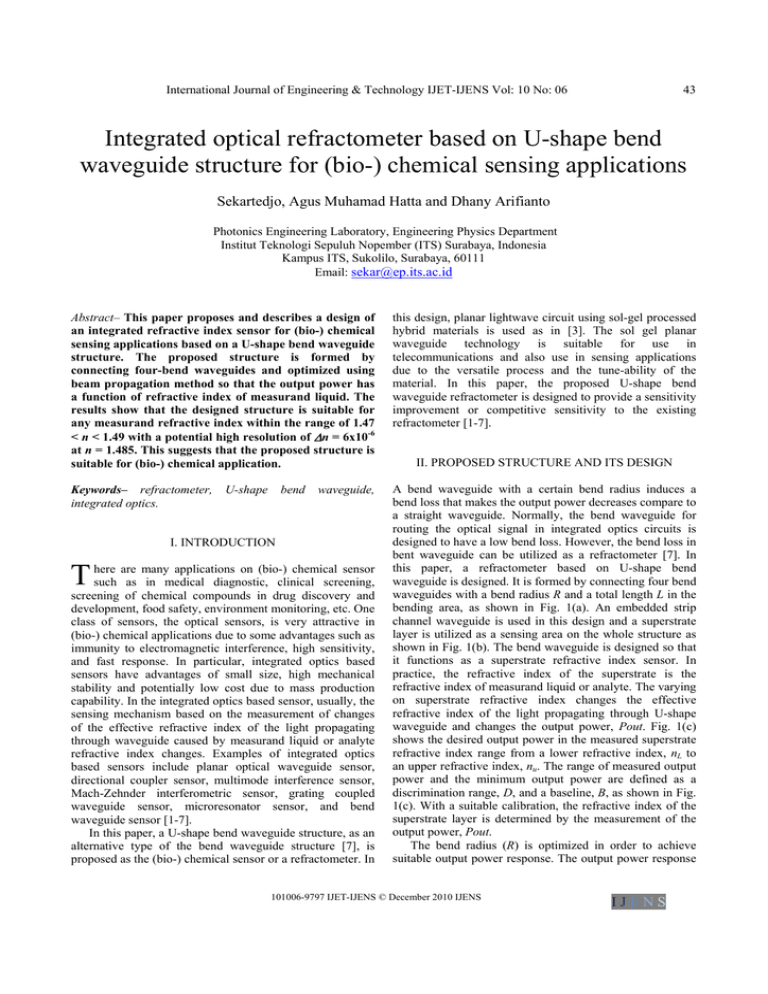
International Journal of Engineering & Technology IJET-IJENS Vol: 10 No: 06 43 Integrated optical refractometer based on U-shape bend waveguide structure for (bio-) chemical sensing applications Sekartedjo, Agus Muhamad Hatta and Dhany Arifianto Photonics Engineering Laboratory, Engineering Physics Department Institut Teknologi Sepuluh Nopember (ITS) Surabaya, Indonesia Kampus ITS, Sukolilo, Surabaya, 60111 Email: sekar@ep.its.ac.id Abstract– This paper proposes and describes a design of an integrated refractive index sensor for (bio-) chemical sensing applications based on a U-shape bend waveguide structure. The proposed structure is formed by connecting four-bend waveguides and optimized using beam propagation method so that the output power has a function of refractive index of measurand liquid. The results show that the designed structure is suitable for any measurand refractive index within the range of 1.47 < n < 1.49 with a potential high resolution of Δn = 6x10⁻⁶ at n = 1.485. This suggests that the proposed structure is suitable for (bio-) chemical application. this design, planar lightwave circuit using sol-gel processed hybrid materials is used as in [3]. The sol gel planar waveguide technology is suitable for use in telecommunications and also use in sensing applications due to the versatile process and the tune-ability of the material. In this paper, the proposed U-shape bend waveguide refractometer is designed to provide a sensitivity improvement or competitive sensitivity to the existing refractometer [1-7]. Keywords– refractometer, integrated optics. A bend waveguide with a certain bend radius induces a bend loss that makes the output power decreases compare to a straight waveguide. Normally, the bend waveguide for routing the optical signal in integrated optics circuits is designed to have a low bend loss. However, the bend loss in bent waveguide can be utilized as a refractometer [7]. In this paper, a refractometer based on U-shape bend waveguide is designed. It is formed by connecting four bend waveguides with a bend radius R and a total length L in the bending area, as shown in Fig. 1(a). An embedded strip channel waveguide is used in this design and a superstrate layer is utilized as a sensing area on the whole structure as shown in Fig. 1(b). The bend waveguide is designed so that it functions as a superstrate refractive index sensor. In practice, the refractive index of the superstrate is the refractive index of measurand liquid or analyte. The varying on superstrate refractive index changes the effective refractive index of the light propagating through U-shape waveguide and changes the output power, Pout. Fig. 1(c) shows the desired output power in the measured superstrate refractive index range from a lower refractive index, nL to an upper refractive index, nu. The range of measured output power and the minimum output power are defined as a discrimination range, D, and a baseline, B, as shown in Fig. 1(c). With a suitable calibration, the refractive index of the superstrate layer is determined by the measurement of the output power, Pout. The bend radius (R) is optimized in order to achieve suitable output power response. The output power response U-shape bend waveguide, I. INTRODUCTION T here are many applications on (bio-) chemical sensor such as in medical diagnostic, clinical screening, screening of chemical compounds in drug discovery and development, food safety, environment monitoring, etc. One class of sensors, the optical sensors, is very attractive in (bio-) chemical applications due to some advantages such as immunity to electromagnetic interference, high sensitivity, and fast response. In particular, integrated optics based sensors have advantages of small size, high mechanical stability and potentially low cost due to mass production capability. In the integrated optics based sensor, usually, the sensing mechanism based on the measurement of changes of the effective refractive index of the light propagating through waveguide caused by measurand liquid or analyte refractive index changes. Examples of integrated optics based sensors include planar optical waveguide sensor, directional coupler sensor, multimode interference sensor, Mach-Zehnder interferometric sensor, grating coupled waveguide sensor, microresonator sensor, and bend waveguide sensor [1-7]. In this paper, a U-shape bend waveguide structure, as an alternative type of the bend waveguide structure [7], is proposed as the (bio-) chemical sensor or a refractometer. In II. PROPOSED STRUCTURE AND ITS DESIGN 101006-9797 IJET-IJENS © December 2010 IJENS IJENS International Journal of Engineering & Technology IJET-IJENS Vol: 10 No: 06 of the U-bend structure is calculated by using a wide angle finite difference beam propagation method (BPM) [8]. z L=R x Pin Pout R R R R (a) Output power, Pout (dB) (b) 44 calculate the output power at the two refractive index, Pout(nL) and Pout(nU) and its discrimination range, D = | Pout(nL) - Pout(nU)|, in the bend radius range. Second step, we select the optimal bend radius based on the maximum D and the minimum baseline loss, for example baseline, B > 30 dB. It is shown in [9], the resolution of intensity-based measurement is degraded beyond the minimum value of the baseline loss of – 30 dB due to the signal to noise ratio (SNR) of a laser source. In this paper, we used the following waveguide parameters: cross section of the singlemode waveguide is 6 μm x 6 μm; the cladding and core index are 1.49 and 1.5, respectively; the superstrate refractive indices range, nL to nU, 1.47 to 1.49, and 1310 nm is the operating wavelength laser source as in [3]. The refractive index of the superstrate represents the measurand properties i.e. biological measurand, chemical concentration, pH, relative humidity (RH) and etc [1-7]. As in [3], the 1.47 to 1.49 of refractive indices range represents the RH from 10 to 80 %, respectively. According to the above procedure, we calculated the output power at the two refractive indices and its discrimination range for the bend radii from 700 to 3000 μm with an increment of 50 μm as presented in Fig. 2. We found the optimal bend radius according to the D and B, is the bend radius R = 1200 μm, with D = 8.367 dB and B = 26.114 dB. The corresponding output power response is presented in Fig. 3. It is clear that the output power response has a monotonically increasing response respect to the superstrate refractive index. This response is suitable for the refractive index measurement. To illustrate a light propagation in the U-shape bend waveguide structure, the optical field profile calculated by the BPM at the superstrate refractive index of 1.485, is presented in Fig. 4. It is shown that the radiation occurs along the U-shape bend waveguide and reduces the output power as a result. (c) Fig. 1 Schematic configuration of integrated refractive index sensor based on U-shape bend waveguide (a) structure top view (b) structure cross section (c) desired transmission response The BPM is a numerical approach that widely used in the design of integrated optical waveguide devices. It is known that the desired transmission response corresponds to increasing output power as the refractive index increases in the measurable range as in Fig. 1(c). To determine an optimal bend radius, we use the following steps: first, we Discrimination range, D, (dB) 10 8 6 4 2 0 1000 101006-9797 IJET-IJENS © December 2010 IJENS 1500 2000 2500 Bend radius, R, (μm) 3000 (a) IJENS International Journal of Engineering & Technology IJET-IJENS Vol: 10 No: 06 III. RESOLUTION DEMONSTRATION OF THE DESIGNED STRUCTURE 0 Baseline, B, (dB) -5 -10 -15 -20 -25 -30 1000 1500 2000 2500 Bend radius, R, (μm) 3000 (b) Fig. 2 (a) Discrimination range and (b) Baseline of the output power Output power, Pout, (dB) -16 -18 -20 -22 -24 -26 -28 1.47 45 1.475 1.48 1.485 Superstrate refractive index 1.49 Fig. 3 Output power -100 To investigate a resolution of the designed structure, refractive index measurement is modeled numerically using a technique developed in [9] by taking account a signal to noise ratio (SNR) of laser source and electrical noise of the photodetector. Assume the SNR of laser source is -55 dB and the noise generated by the photodetector and electronic circuitry is equivalent to a variance in the measurement of 0.002 dB. In the numerical model, the refractive index of the superstrate layer is changed from 1.485 by successive increments of 2x10⁻⁶, 4x10⁻⁶, 6x10⁻⁶, 8x10⁻⁶ and 10x10-6. The photodetector output is sampled 100 times and the output power of the photodetector is calculated for each superstrate refractive index. Fig. 5 shows the complete time series of the calculated output power values as a function of sample time and the superstrate refractive index increments. By changing the refractive index of superstrate incrementally and monitoring the output power as in Fig. 5, it is clear that the minimum detectable change in superstrate index for this structure is about 6x10⁻⁶ RIU (refractive index unit). The proposed structure can function as a refractive index sensor with a suitable resolution by comparison with sensing structures based on directional couplers, bent waveguide or microring resonators which exhibit resolution in the order of 5x10⁻⁵, 1x10⁻⁵ or ~10-5, respectively [2, 6, 7]. For an optical power measurement technique, it is necessary to consider an optical source signal power variation. The power fluctuation of optical source can produce a measurement error. Therefore, a ratiometric power measurement technique can be used which consists of the optical source, a power divider or splitter with two waveguides connected to U-shape bend waveguide sensor and a reference arm. The output power at the end of each arm is monitored by using an optical power meter. The refractive index can be determined by measuring the ratio of the two output power, assuming a calibration has been carried out. start superstrate refractive index = 1.485 -20.604 -20.606 Output power, Pout (dB) x (μm) -50 0 50 10e-6 -20.608 -20.61 8e-6 -20.612 6e-6 -20.614 4e-6 -20.616 2e-6 -20.618 100 250 500 750 z (μm) 1000 1250 Fig. 4 Optical field profile calculated by BPM at superstrate refractive index 1.485 -20.62 0 100 200 300 times 400 500 600 Fig. 5 Output power as the superstrate refractive index is altered over time 101006-9797 IJET-IJENS © December 2010 IJENS IJENS International Journal of Engineering & Technology IJET-IJENS Vol: 10 No: 06 46 IV. CONCLUSIONS The U-shaped bend waveguide has been presented as a refractometer for (bio-) chemical sensing applications. The bend radius of U-shape structure is optimized by using BPM. The sensing resolution is demonstrated numerically with a resolution of 6x10⁻⁶ RIU that suitable for (bio-) chemical sensing applications. REFERENCES [1] [2] [3] [4] [5] [6] [7] [8] [9] T. Okamoto, M. Yamamoto, and I. Yamaguchi, “Optical waveguide absorption sensor using a single coupling prism,” J. Opt. Soc. Amer. A, Opt. Image Sci., vol. 17, no. 10, pp. 1880–1886, Oct. 2000. B. J. Luff, R. D. Harris, J. S. Wilkinson, R. Wilson, and D. J. Schiffrin, “Integrated-optical directional coupler biosensor,” Opt. Lett., vol. 21,no. 8, pp. 618–620, Apr. 1996. K. R. Kribich, R. Copperwhite, H. Barry, B. Kolodziejczyk, J.-M. Sabattie, K. O’Dwyer, B.D. MacCraith, “Novel chemical sensor/biosensor platform based on optical multimode interference (MMI) couplers,” Sens. Actuator B, Chem., 107, pp. 188-192, 2005. Z. Qi, N. Matsuda, K. Itoh, M. Murabayashi, and C. R. Lavers, “A design for improving the sensitivity of a Mach– Zehnder interferometer to chemical and biological measurands,” Sens. Actuators B, Chem., 81, pp. 254–258, 2002. R. Hornath, H. C. Pedersen, N. Skivesen, D. Selmeczi, and N. B. Larsen, “Monitoring of living cell attachment and spreading using reverse symmetry waveguide sensing”, Appl. Phys. Lett., vol. 86, no. 7, pp. 071101, Feb. 2005. Chung-Yen Chao and L. Jay Guo, Design and optimization of microring resonators in biochemical sensing applications,” J. Lightwav. Technol., vol. 24, no. 3, pp. 1395-1402, March, 2006. G. J. Veldhuis, L. E. W. van der Veen, and P. V. Lambeck, “Integrated optical refractometer based on waveguide bend loss”, J. Lightwav. Technol., vol. 17, no. 5, pp. 857-864, may, 1999. J. Yamauchi, Propagating Beam Analysis of Optical Waveguides, Research Studies Press, pp.89-97, 2003. Q. Wang, G. Rajan, P. Wang and G. Farrell, “Resolution investigation of a ratiometric wavelength measurement system,” App. Opt. vol. 46, no. 25, pp. 6362-6367, 2007. 101006-9797 IJET-IJENS © December 2010 IJENS IJENS
