VOL. 10, NO. 5, March 2015
ARPN Journal of Engineering and Applied Sciences
ISSN 1819-6608
©2006-2015 Asian Research Publishing Network (ARPN). All rights reserved.
www.arpnjournals.com
DEVELOPMENT OF REAL TIME MONITORING SYSTEM UNDER
SMART GRID ENVIRONMENT
M. Krishna Paramathma, D. Devaraj and Malaikannan R.
Department of Electronics and Electrical Engineering, Kalasalingam University, Tamil Nadu, India
ABSTRACT
Real time monitoring of power system is essential for its continuous and reliable operation. This paper presents a
low cost, low power consuming system that can be used for quick and accurate power system parameter monitoring under
smart grid environment. The designed system will continuously measures, processes and display the power system
parameters like voltage, current, phasor difference, power factor, power consumption using ultra low power
microcontroller. Measurement of power system parameters of resistive and inductive loads are monitored using
PIC16F877A microcontroller. Sampling theorem is used to calculate the phase difference between voltage and current
utilizing zero crossing detectors. Simulations of the voltage, current, phasor difference were done using NI Multisim
software.
Keywords: smart grid, power system parameters, NI multisim, sampling theorem, zero crossing.
1.
INTRODUCTION
India’s electrical infrastructure is considered
untrustworthy though it is the world's third largest
electricity producer and consumer. The northern grid
collapsed in 2001 and most of northern and
eastern India peoples were affected severely by the power
outages on July 30 and 31, 2012. The constant growth of
the electrical network and the need for stringent security
and reliability levels of the power system infrastructures
lead to the development of smart electrical grid. Real time
monitoring of the power system is an important aspect of
Smart grid system. It involves measuring the voltage and
current waveforms in real time and the detection of the
power system disturbances that occur during the operating
condition [1]. The AMR system proposed in [2] consists
of ARM cortex, RF transmitter, receiver with current,
voltage sensors which incurs more space and cost. This
paper describes the development of real time power
system parameters monitoring system based on
PIC16F877 Controller and zero crossing detectors. The
purpose of real time monitoring system is to improve the
declining meter efficiency in meter readings hence this
proposed system components are simple and low cost.
2.
SMART GRID INFRASTRUCTURE AND
MOTIVATION
Smart Grid is one of the leading technology that
incorporates information and communications technology
into every feature of electricity generation, distribution
and consumption in order to minimize environmental
impact. It will link power plant to the end consumer in
homes, business and industries to bring energy efficiency
and reliability. A Smart Grid consists of the following
components: a) demand side management, generation side
management and transmission and distribution grid
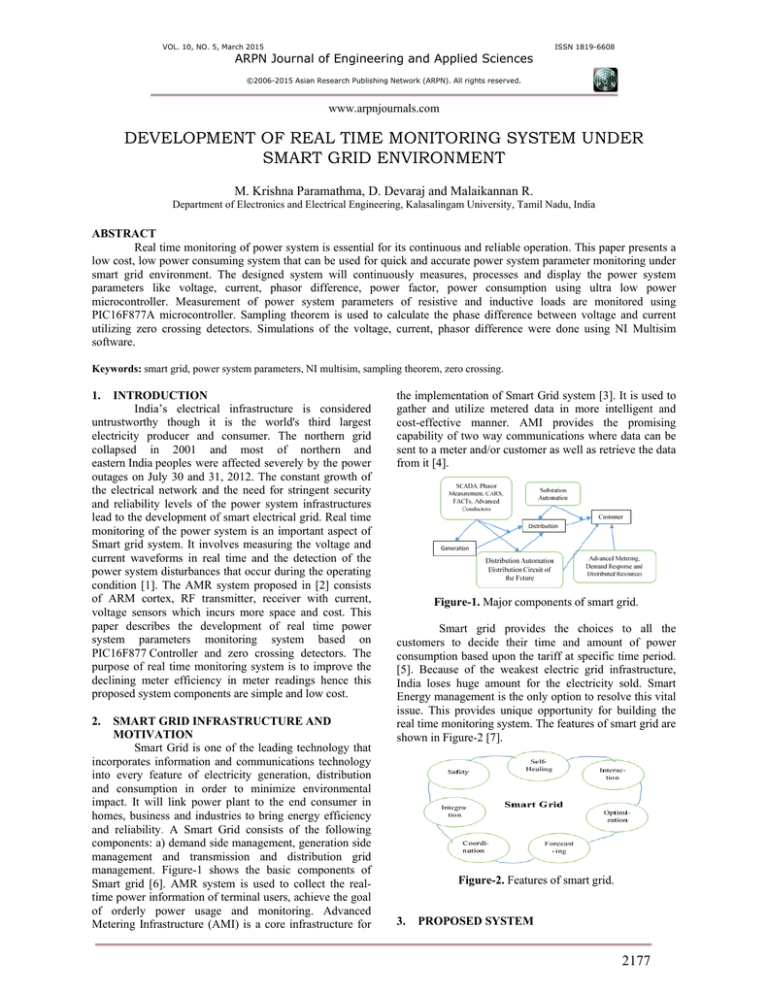
management. Figure-1 shows the basic components of
Smart grid [6]. AMR system is used to collect the realtime power information of terminal users, achieve the goal
of orderly power usage and monitoring. Advanced
Metering Infrastructure (AMI) is a core infrastructure for
the implementation of Smart Grid system [3]. It is used to
gather and utilize metered data in more intelligent and
cost-effective manner. AMI provides the promising
capability of two way communications where data can be
sent to a meter and/or customer as well as retrieve the data
from it [4].
Figure-1. Major components of smart grid.
Smart grid provides the choices to all the
customers to decide their time and amount of power
consumption based upon the tariff at specific time period.
[5]. Because of the weakest electric grid infrastructure,
India loses huge amount for the electricity sold. Smart
Energy management is the only option to resolve this vital
issue. This provides unique opportunity for building the
real time monitoring system. The features of smart grid are
shown in Figure-2 [7].
Figure-2. Features of smart grid.
3.
PROPOSED SYSTEM
2177
VOL. 10, NO. 5, March 2015
ARPN Journal of Engineering and Applied Sciences
ISSN 1819-6608
©2006-2015 Asian Research Publishing Network (ARPN). All rights reserved.
www.arpnjournals.com
The block diagram representation of the proposed
monitoring system is shown in Figure-3. CT and PT are
used to senses the current and voltage of the load. The
rectifier circuit (OPAMP+diode) converts AC to DC. Zero
crossing detector circuit detects the voltage zero crossing
point and current zero crossing point. After the zero
crossing of voltage and current signals, square-wave
which created in between the zero crossing of voltage and
current are given to PIC microcontroller. Rectified DC
voltage and current are read by the PIC microcontroller
using ADC ports. Power factor is measured using the
microcontroller by manipulating the acquired signals from
voltage and current sensing circuit. Real power is
calculated as
(1)
Figure-3. Electrical parameter monitoring system.
The calculations are completed for the ideal
sinusoidal voltage in programming the microcontroller. T
is the time period of the signal. Total time period of
sinusoidal divided into microseconds. One part of entire
sinusoidal signal’s time interval is calculated and equal to
One degree. At 50Hz a full cycle (360degrees) takes 20ms,
so a half cycle takes 10ms. 10ms into 180 time slots of 180
samples, then each time slot equals 1 degree, so 10/180ms
= 55.5µs per 1 degree. The measurement limits of the
phase angle are between 0 to 90 degree.
4.
SIMULATION RESULT
In this section, simulation details are presented
for resistive and inductive load for power system
parameter monitoring using the proposed approach. The
power system parameters like voltage, currrent, difference
were simulated using Multisim software.
The current signal is obtained from the secondary
of 10:1 current transformer whose primary is connected in
series with load. This CT is also used to measure zero
crossing of current signal to obtain the voltage parameter.
The microcontroller is connected to the secondary ofa 20:1
potential transformer for which the primary is connected
in parallel to the load circuit. Zero crossing of voltage
signal is measured from the secondary of PT. LS7408 is
used to compare the output of zero crossing detectors
which are in turn connected with CT and PT. Figure-5
shows the sensing circuit developed using NI Multisim
software.
a) Design details
Micro C based software is developed to calculate
voltage, current, phase angle, power factor, energy and
tariff.
b) Functioning of the monitoring system
Sampling of the current and voltage can be done
for functions changing in space, time, or any other
dimension, and similar results are obtained in two or more
dimensions. Consider f (t) be a continuous function of the
sample, for which the function that differs with time.
Sampling will be achieved by measuring the value of the
continuous function for every T seconds
for integer values of n
(2)
Let fsbe the sampling frequency or sampling rate. It is the
average number of samples obtained per second.
Figure-4. Phase angle detection.
Figure-5. Sensing circuit developed using multisim.
Figure-6 shows the four channel output to
calculate the phase angle by measuring zero crossing
between voltage and current of the two LM311 (zero
crossing detector), one of them is used for current signal
and other one is used for the zero crossing detection of
voltage and current. Square pulses are generated in
between the crossing intervals of voltage and current.
2178
VOL. 10, NO. 5, March 2015
ARPN Journal of Engineering and Applied Sciences
ISSN 1819-6608
©2006-2015 Asian Research Publishing Network (ARPN). All rights reserved.
www.arpnjournals.com
Figure-6. Simulation result for phasor difference.
5.
HARDWARE IMPLEMENTATION
The hardware details are explained in this
section.Figure-7 shows a resistive (R) and inductive load
(L) connected to the power supply. PT is connected in
parallel to the load. CT is connected in series with the
load. From the secondary of CT and PT signals were
obtained and fed to the microcontroller (PIC 16F877A).
Received signals were converted to digital form by using
internal ADC. Zero crossing signals were detected using
dedicated GPIO. The parameters are calculated and
displayed.
Figure-9. Meter readings under Inductive and resistive
load.
Figure-9 shows the measured electrical parameter
in the LCD display when there are inductive and resistive
loads connected. It shows 161W as the reading of loads.
Here 100W is consumed by resistive load and 60W is
consumed by inductive load.
Phase angle measurements with of resistive and
inductive loads were done and the results are displayed.
One can clearly see a gradual raise in the phase angle and
reduction in power factor, when inductive load was added.
Table-1. Comparison between resistive and induction
load results.
Parameters
Voltage (V)
Current (I)
Phase angle (Φ)
.Figure-7. Photograph of the developed hardware.
Figure-8 shows the measured electrical parameter
in the LCD Display when only resistive load is connected
and display unit shows 101W as reading.
Figure-8. Meter readings under resistive load condition.
Power
factor
(Cos Φ)
Power (Watts)
Resistive
load
Resistive &
Inductive
loads
230V
233V
0.44A
0.71A
8˚
31˚
0.990
0.857
101W
161W
The comparison of various parameters available in the
Table-1 shows that, the developed hardware is well suited
for the smart grid environment implementation in
domestic side.
6. CONCLUSIONS AND FUTURE WORK
The reliability of the smart grid depends on the
embedded intelligent devices used. The proposed and
demonstrated work explains the method of sensing the
voltage, current, phase angle consumed by the loads with
the help of voltage and current sensing circuit. The voltage
and current, square pulse generated using zero crossing
detectors are sent to the PIC micro controller. The
measured voltage, current, real power, power factor, phase
angle, power consumptions of the load are viewed through
LCD display. This provide the end user, real time
monitoring capability, thus giving a choice to take
decision whether to consume power at a given point of
2179
VOL. 10, NO. 5, March 2015
ARPN Journal of Engineering and Applied Sciences
ISSN 1819-6608
©2006-2015 Asian Research Publishing Network (ARPN). All rights reserved.
www.arpnjournals.com
time. This real time information is vital in a smart grid
environment, where electricity prices vary dynamically
according to the demand.
The future work of this project is to develop PIC
microcontroller based smart device that measures and
display energy consumption for major home appliance and
also tariff details. Interfacing of PIC microcontroller with
Raspberry Pi using wireless communication could be
done. Once the data’s received from PIC, Raspberry Pi can
process the data and it will be uploaded into web server.
Based on the data provided in real time one can control the
appliances virtually from anywhere in the world using
internet.
REFERENCES
Transactions on Smart Grid Communications Surveys
& Tutorials, Vol.15, No.1, pp. 5-20, First Quarter.
[9] Colmenar- Santos, Antonio, Oscar MonzónAlejandro, David Borge-Diez, and Manuel CastroGill. 2013. The impact of different grid regulatory
scenarios on the development of renewable energy on
islands: A comparative study and improvement
proposals, Renewable Energy.
[10] Nian Liu, Jinshan Chen, Lin Zhu, Jianhua Zhang. and
Yanling He. 2013. A Key Management Scheme for
Secure Communications of Advanced Metering
Infrastructure in Smart Grid. IEEE Transactions
onIndustrial Electronics. Vol. 60, no. 10, pp. 4746,
4756, October.
[1] Tomá˘s Radil, Pedro M. Ramos, Fernando M. Janeiro.
and Cruz Serra. 2008. PQ Monitoring System for
Real-Time Detection and Classification of
Disturbances in a Single-Phase Power System. IEEE
Transaction on Instrumentation and Measurement.
[11] Prudhvi P., Bhalodi D., Manohar M., Padidela V. and
Adapa S. 2012. A Smart energy Meter Architecture in
Indian context. (ICSG), 2012 2nd Iranian Conference
onSmart Grids. Vol., no., pp.1,6, 24-25 May.
[2] Khalifa Naik K. and Nayak A. 2011. A Survey of
Communication Protocols for Automatic Meter
Reading Applications Communications Surveys &
Tutorials. IEEE, Vol.13, no.2, pp.168, 182, Second
Quarter.
[12] Bruce Stephen, Antti J. Mutanen, Stuart Galloway,
Graeme Burt. and Pertti Järventausta. 2014. Enhanced
Load Profiling for Residential Network Customers.
IEEE Transactions on Power Delivery. Vol. 29, No. 1,
February.
[3] Li Li., Hu Xiaoguang, Huang Jian. and He Ketai.
2011. Design of new architecture of AMR system in
Smart Grid. Industrial Electronics and Applications
(ICIEA), 2011 6th IEEE Conference on , Vol. no.,
pp.2025,2029, 21-23 June.
[13] Shyh-Jier Huang, Tsai-Ming Yang, and Jiann-Tseng
Huang. 2002. FPGA Realization of Wavelet
Transform for Detection of Electric Power System
Disturbances”, IEEE Transactions On Power
Delivery, Vol. 17, No. 2, April.
[4] Huibin Sui, Honghong Wang, Ming Shun Lu. And
Wei-jen Lee. 2009 . An AMI System for the
Deregulated Electricity Markets. IEEE Transactions
on Industry Applications.Vol. 45, No. 6, November.
[14] Vladimir V. Terzija. 2007. Senior Member. IEEE, and
Vladimir Stanojevic, “Two-Stage Improved Recursive
Newton-Type Algorithm for Power-Quality Indices
Estimation.
IEEE
Transactions
on
Power
Delivery.Vol. 22, No. 3, July, 1351.
[5] Arup Sinha, S.Neogi, Non-Member, R. N. Lahiri, S.
Chowdhury, S. P. Chowdhury. and N. Chakraborty.
2011. Smart Grid Initiative for Power Distribution
Utility in India. 978-1-4577-1002-5/11/$26.00 IEEE.
[6] Tamilmaran Vijayapriya. and Dwarkadas Pralhadas
Kothari. 2011. Smart Grid: An Overview”, Smart
Grid and Renewable Energy, 2, pp. 305-31.
[7] Siming Li, Yunhui Chen, Jing He, Yongding Fu,
Bangfeng Li, Hui Hou, Jianzhong Zhou. and
Yongchuan Zhang. 2011. Discussion on Smart Grid
Development in China" Power and Energy
Engineering Conference (APPEEC), 2011 AsiaPacific. Vol. no., pp.1,4, 25-28, March.
[8] Yan, YiQian, Sharif. and Tipper. 2013. A Survey on
Smart
Grid
Communication
Infrastructure,
Motivation, Requirements and Challenges”, IEEE
[15] Antonio Moreno-Muñoz, Victor Pallarés- López, Juan
José González de la Rosa, Rafael Real-Calvo, Miguel
González-Redondo. and M. Moreno-García. 2013.
Embedding Synchronized Measurement Technology
for Smart Grid Development. IEEE Transaction on
Industrial Informatics. Vol. 9, No. 1, February.
[16] Zhenyu Huang, Pengwei Du, Dmitry Kosterev. and
Steven Yang. 2013. Generator Dynamic Model
Validation and Parameter Calibration Using Phasor
Measurements at the Point of Connection. IEEE
Transactions on power systems. Vol. 28, No. 2, May.
[17] Tevhid Atalik, Isik Çadirci, Turan Demirci,
Muammer Ermis, Tolga Inan, Alper Sabri
Kalaycioglu. and Özgül Salor. 2014. Multipurpose
Platform for Power System Monitoring and Analysis
With Sample Grid Applications. IEEE Transactions
2180
VOL. 10, NO. 5, March 2015
ARPN Journal of Engineering and Applied Sciences
ISSN 1819-6608
©2006-2015 Asian Research Publishing Network (ARPN). All rights reserved.
www.arpnjournals.com
on Instrumentation and measurement. Vol. 63, No. 3,
March.
[18] Antonio Moreno-Muñoz, Victor Pallarés-López, Juan
José González de la Rosa, Rafael Real-Calvo, Miguel
González- edondo. and
Moreno-García. 2013.
Embedding Synchronized Measurement Technology
for Smart Grid Development, IEEE Transactions on
Industrial Informatics. Vol. 9, No. 1, February.
[22] Montenegro, Hernandez, Ramos, G.A. 2012. Real
time OpenDSS framework for distribution systems
simulation
and
analysis," Transmission
and
Distribution: Latin America Conference and
Exposition (T&D-LA), 2012 Sixth IEEE/PES. Vol.,
no., pp.1, 5, 3-5 September.
[19] Kim D.S., Son. S. and Lee J. 2013. Development of
in-home display systems for residential energy
monitoring. IEEE Transactions on Consumer
Electronics. Vol.59, No.3, Pages (492-498), August.
[20] Alahmad M. Wheeler P. G., Schwer A., EidenJ. and
Brumbaugh A. 2012. A Comparative Study of Three
Feedback devices for Residential Real Time Energy
Monitoring. IEEE Transaction on Industrial
Electronics. Vol. 59, No.4, Pages (2002-2013), April.
[21] M. Kuzlu, M. Pipattanasomporn. and S. Rahman.
2013. Hardware Demonstration of a Home Energy
Management System for Demand Response
Applications. IEEE Transactions on Smart Grid. Vol.
3, No. 4, July.
2181


