Urban Congestion Rankings
advertisement
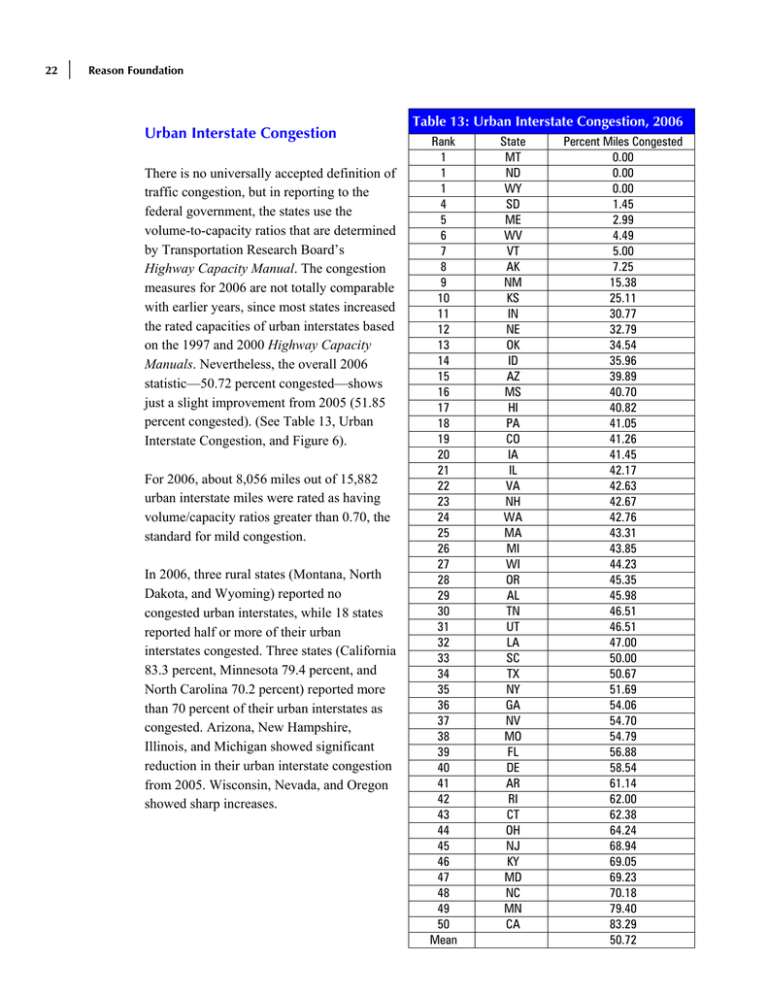
22 Reason Foundation Urban Interstate Congestion There is no universally accepted definition of traffic congestion, but in reporting to the federal government, the states use the volume-to-capacity ratios that are determined by Transportation Research Board’s Highway Capacity Manual. The congestion measures for 2006 are not totally comparable with earlier years, since most states increased the rated capacities of urban interstates based on the 1997 and 2000 Highway Capacity Manuals. Nevertheless, the overall 2006 statistic—50.72 percent congested—shows just a slight improvement from 2005 (51.85 percent congested). (See Table 13, Urban Interstate Congestion, and Figure 6). For 2006, about 8,056 miles out of 15,882 urban interstate miles were rated as having volume/capacity ratios greater than 0.70, the standard for mild congestion. In 2006, three rural states (Montana, North Dakota, and Wyoming) reported no congested urban interstates, while 18 states reported half or more of their urban interstates congested. Three states (California 83.3 percent, Minnesota 79.4 percent, and North Carolina 70.2 percent) reported more than 70 percent of their urban interstates as congested. Arizona, New Hampshire, Illinois, and Michigan showed significant reduction in their urban interstate congestion from 2005. Wisconsin, Nevada, and Oregon showed sharp increases. Table 13: Urban Interstate Congestion, 2006 Rank 1 1 1 4 5 6 7 8 9 10 11 12 13 14 15 16 17 18 19 20 21 22 23 24 25 26 27 28 29 30 31 32 33 34 35 36 37 38 39 40 41 42 43 44 45 46 47 48 49 50 Mean State MT ND WY SD ME WV VT AK NM KS IN NE OK ID AZ MS HI PA CO IA IL VA NH WA MA MI WI OR AL TN UT LA SC TX NY GA NV MO FL DE AR RI CT OH NJ KY MD NC MN CA Percent Miles Congested 0.00 0.00 0.00 1.45 2.99 4.49 5.00 7.25 15.38 25.11 30.77 32.79 34.54 35.96 39.89 40.70 40.82 41.05 41.26 41.45 42.17 42.63 42.67 42.76 43.31 43.85 44.23 45.35 45.98 46.51 46.51 47.00 50.00 50.67 51.69 54.06 54.70 54.79 56.88 58.54 61.14 62.00 62.38 64.24 68.94 69.05 69.23 70.18 79.40 83.29 50.72
