BIOVIA MATERIALS STUDIO
VISUALIZER
DATASHEET
BIOVIA Materials Studio Visualizer is the core product of the
BIOVIA Materials Studio software suite, which is designed to
support the materials modeling needs of the chemicals and
materials-based industries. BIOVIA Materials Studio brings
science validated by leading laboratories around the world to
your desktop PC. BIOVIA Materials Studio Visualizer contains
the essential modeling functionality required to support
computational materials science. It can help you understand
properties or processes related to molecules and materials.
BIOVIA Materials Studio Visualizer allows you to see models
of the system you are studying on your Windows desktop,
increasing your understanding by allowing you to visualize,
manipulate, and analyze the models. You can also make better
use of access to structural data, improve your presentation
of chemical information, and communicate problems and
solutions to your colleagues very easily.
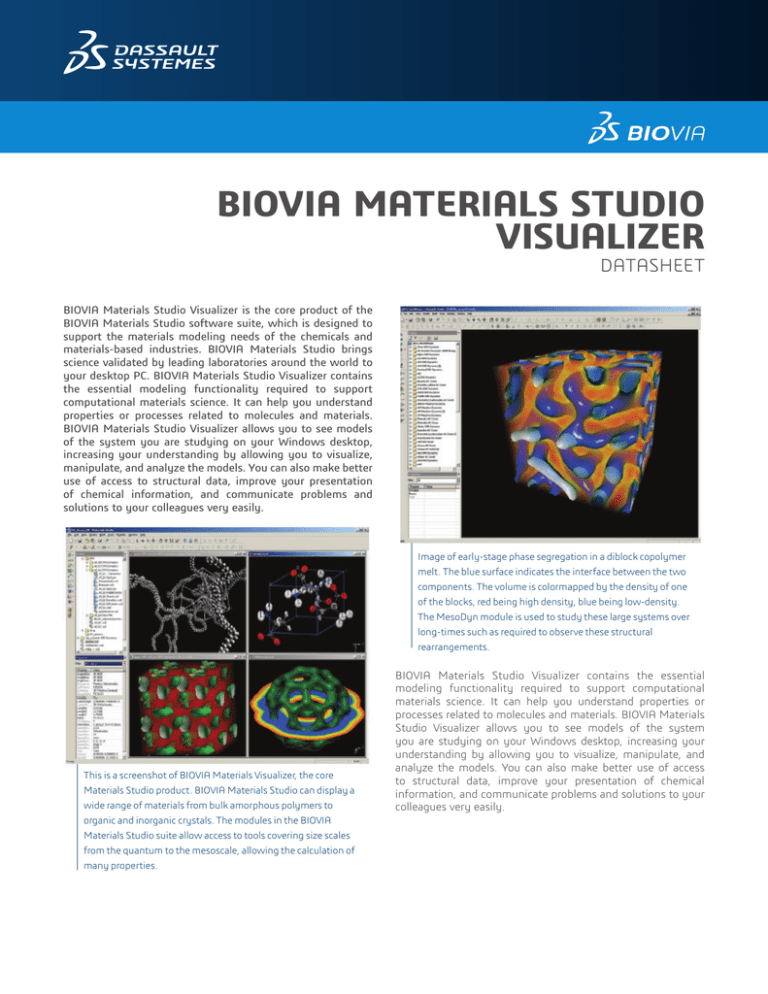
Image of early-stage phase segregation in a diblock copolymer
melt. The blue surface indicates the interface between the two
components. The volume is colormapped by the density of one
of the blocks, red being high density, blue being low-density.
The MesoDyn module is used to study these large systems over
long-times such as required to observe these structural
rearrangements.
This is a screenshot of BIOVIA Materials Visualizer, the core
Materials Studio product. BIOVIA Materials Studio can display a
wide range of materials from bulk amorphous polymers to
organic and inorganic crystals. The modules in the BIOVIA
Materials Studio suite allow access to tools covering size scales
from the quantum to the mesoscale, allowing the calculation of
many properties.
BIOVIA Materials Studio Visualizer contains the essential
modeling functionality required to support computational
materials science. It can help you understand properties or
processes related to molecules and materials. BIOVIA Materials
Studio Visualizer allows you to see models of the system
you are studying on your Windows desktop, increasing your
understanding by allowing you to visualize, manipulate, and
analyze the models. You can also make better use of access
to structural data, improve your presentation of chemical
information, and communicate problems and solutions to your
colleagues very easily.
WHAT CAN BIOVIA MATERIALS STUDIO
VISUALIZER DO?
BIOVIA Materials Studio Visualizer provides modeling, analysis,
and visualization tools, combined with its clear and intuitive
graphical user interface. It offers a high-quality environment
into which you can plug any BIOVIA Materials Studio product.
Within this versatile and completely comprehensive modeling
and visualization system, you can:
•
•
•
•
•
•
•
•
increase your understanding of materials
improve your communication of chemical information
visualize and model structures from chemical databases
build your own molecules and materials with fast, interactive
sketching, building and editing tools
calculate and display key structural parameters
display the results of calculations – animated dynamics
trajectories, graph data, and molecular models
use scripting to harvest the full power of BIOVIA Materials
Studio Visualizer
annotate models for pictures and diagrams and produce
exceptionally high quality hard-copy output
Arrangement of water molecules at the tip of a carbon
nanotube (CNT). Also displayed is the HOMO, which
is seen to be localized on the CNT. Such quantum
mechanical calculations have been used to gain
insight into the observed influence of water content
on conductance in a single-walled CNT.
BIOVIA Materials Studio Visualizer can run on any PC on your
network, allowing scientists to use it when and where they
need it. Whether used to run a range of BIOVIA Materials Studio
modules or as a stand-alone modeling system, BIOVIA Materials
Studio Visualizer focuses computational and graphics power on
the solution of scientific problems.
FEATURES
Graphical User Interface
• Easy-to-use user interface conforming to Microsoft® standards
• Comprehensive, context-sensitive, and fully searchable on-line
help, including tutorials covering the main functionality
• Multiple undo/redo
• Project Explorer offers fast, structured access to project data
in a standard file explorer view
• Tool and menu bar access to other Materials Studio products
• Tools to manage and monitor calculations on remote or local
servers support use of BIOVIA Materials Studio Visualizer
with other Materials Studio products
• Management of the default project settings
Display and Communication
• Display, manipulation, and overlay of high quality 3-D graphical
models of materials and molecular structure (details follow)
• Display and manipulation of results as 1-D and 2-D graph data
• Display of model and results data in textual and tabular formats
• Cut-copy-paste to other PC applications for structural,
graphical, tabular, and textual data
• File communication with in-house and commercial structure
databases
• Supports a wide range of industry-standard file formats for
structural, graphical, textual, and experimental data:
• Structure files: xsd (native), xtd (native), xod (native), msi, car/
mdf, cif, mol, sdf, sd,mdl, skc, arc/mdf, his/mdf, acx, trj/msi,
.res/. ins (Shelx), pdb, xyz
• Chart files: xcd (native), csv, tbl
• Table/ Grid files: xgd (native) csv, tbl, std (native)
• Text files: txt, htm, pl
Building and Editing Molecular Models
• Fast creation of molecular models using a unique 3-D sketcher
• Automatic hydrogen addition tool for quick molecular sketching
• Fragment sketcher allows fast creation of complex molecules,
such as organometallic compounds; includes comprehensive
fragment library and tools to enable user-defined fragments
• Clean utility determines good molecular geometries
• Easy editing and input of coordinates and atom properties
• Precise atom/object movement and rotation tools
• Precise atom positioning tools
• User-definition and editing of bond order and hybridization
• Display and editing of the properties of all elements, including
a periodic table viewer
• Simple cut, copy, and paste of models and parts of models
• Versatile bond calculation tools
• Symmetry finder for non-periodic systems
• Includes extensive library of molecular, crystalline, and
amorphous structures
• Align molecules in specific directions
Specialist Polymer Building Tools
• Polymer builder enables construction of homopolymers,
block, and random copolymers, or dendrimers
• Comprehensive library of repeat units
• Tools to enable user-defined repeat units
• Branch generation tool
Specialist Crystal, Surface, and Layer Building Tools
• Crystal builder enables construction of periodic systems
based on lattice parameters, atom positions, and symmetry
• Input and editing of symmetry information, including
comprehensive space-group information
• Symmetry finder analyzes periodic models and returns
symmetry details
• Easy to use supercell creation tool
• Versatile surface builder enables easy surface construction
from non-periodic structures using plane group symmetry,
or crystals using a cleave method
• Surface builder can create surfaces with vacuum slabs from
crystal structures
• Layer builder creates layered structures from either crystalline
or amorphous materials, or combinations of both
ANALOG BUILDING TOOLS
•
•
•
•
Markush library enumeration
Maintains 3-D geometry
Specify multiple cores
R-Groups defined from fragment library
Nanotechnology Building Tools
•
•
•
•
Tools available for both single and multi-walled nanotubes
Specify carbon or boron Nitride tubes
Build nanoropes
Create nanoclusters from crystals
Template Building Tools for Mesoscale Structures
• Build templates that can be filled with beads to specify
starting conditions for mesoscale calculations
• Add variety of formers such as droplets, rods, slabs, shells,
and tubes
• Define size, orientation, position, and priority of formers
• Assign different material fillers to the formers
• Build ordered structures such as micelles and bilayers
Mesoscale Molecule Building Tools
• Powerful tool for building bead representations of molecules
• Build simple linear chains and complex branched structures
such as dendrimers
• Builds randomized bead structures
Coarse Graining Tools
•
•
•
•
•
Convert molecules or groups of atoms to beads
Coarse grain polymers by repeat unit
Define patterns to coarse grain molecules with no subunit data
Preview prior to coarse graining
Automatically generate new bead types
General Visualization Tools
• Wide range of display styles—line, stick, ball and stick, space
filling spheres (CPK), polyhedral
• Real-time mouse rotation and scaling of models
• Option of orthogonal or perspective views of models
• Full customization of the colors of objects in the model and
of the background color
• Choice of a wide range of background textures and images, and
the ability to add user-created bitmaps as background images
• Control over rendering quality, including speed-up of model
manipulation by ‘fast render on move’
• Control over the number of unit cells displayed for a periodic
model (including non-integer ranges)
• Display of thermal ellipsoids
• High quality, flexible display of volumetric data from quantum
and other calculations (of charge density, potentials, orbitals)
• Display of surface data from quantum and other calculations
(of charge density, potentials, orbitals)
• Display of crystal habits including coloring and transparency
from morphology calculations
• Control over lighting of the model, including multiple light
sources and the ability to alter color and position
• Optional display and labeling of axis and 3-D or 2-D lattices
• Custom coloring of all objects
Model Measurement and Analysis
• Measurement and display of distances, angles, and torsions
– updated during structure manipulation
• Create and visualize geometry objects such as principal
moments, centres of mass, and planes
• Calculation and display of close contacts and hydrogen bonds
• Calculation and display of solvent and conolly surfaces;
includes occupied and accessible volumes and surface areas
• Visualization of Miller Planes for crystals and surfaces
• Superpose multiple physical systems and fit them to either
a target or consensus structure using RMS atoms, moment,
or field fitting
• Context-sensitive properties explorer provides text display of
the properties of atoms and other objects
• Animation of trajectory files (for example, from molecular
dynamics)
• Reaction preview and atom matching tools for use as input to
transition state searches
• Vibrational analysis tool for displaying and animating normal
modes and spectra
• Labeling of molecular models
Field Visualization and Analysis
•
•
•
•
•
•
•
•
•
•
•
•
•
•
•
•
•
•
•
•
•
•
Visualize fields as dots or volumes
Create custom field data using scripting
Plot distribution of field data
Generate isosurfaces at specific field values
Map field data onto isosurfaces to enhance understanding
Visualize multiple slices of field data
Orientation of the view along slice normals
Partition fields into isolated segregates
Analyze segregate size, radius and separation distributions
Scripting
Environment for developing Perl scripts including syntax
checking and debug tools
New Perl script document with line numbering, bookmarks,
and syntax coloring
MaterialsScript API to control 3-D model documents:
Access to all properties on the Properties explorer
Manipulate geometry objects such as monitors, centroids etc.
Manipulate atoms and bonds
Calculate bonds, hydrogen bonds, and close contacts
Calculate conolly and solvent surfaces
Build polymers, crystals, surfaces, and layers
Use the symmetry tools such as SuperCell
Create and manipulate field data
MaterialsScript API can be used to control the content of the
study table
Comprehensive on-line documentation of the API
Statistical Tools
• Univariate analysis gives mean, standard deviation,
distribution data, etc.
• Data transformation tool
• Data standardization tool
• Generation of colored correlation matrices
Presentation
• Windows-standard page setup and output to printer
• Export of bitmap image creates high quality graphics for
reports and presentations
• Export of trajectory files as video files in Microsoft .avi format
©2014 Dassault Systèmes. All rights reserved. 3DEXPERIENCE, the Compass icon and the 3DS logo, CATIA, SOLIDWORKS, ENOVIA, DELMIA, SIMULIA, GEOVIA, EXALEAD, 3D VIA, BIOVIA and NETVIBES are commercial trademarks
or registered trademarks of Dassault Systèmes or its subsidiaries in the U.S. and/or other countries. All other trademarks are owned by their respective owners. Use of any Dassault Systèmes or its subsidiaries trademarks is subject to their express written approval.
To learn more about BIOVIA Materials Studio, go to
accelrys.com/materials-studio
Our 3DEXPERIENCE Platform powers our brand applications, serving 12 industries, and provides a rich
portfolio of industry solution experiences.
Dassault Systèmes, the 3DEXPERIENCE Company, provides business and people with virtual universes to imagine sustainable innovations. Its world-leading
solutions transform the way products are designed, produced, and supported. Dassault Systèmes’ collaborative solutions foster social innovation, expanding
possibilities for the virtual world to improve the real world. The group brings value to over 170,000 customers of all sizes in all industries in more than 140
countries. For more information, visit www.3ds.com.
Dassault Systèmes Corporate
Dassault Systèmes
175 Wyman Street
Waltham, Massachusetts
02451-1223
USA
BIOVIA Corporate Americas
BIOVIA
5005 Wateridge Vista Drive,
San Diego, CA
92121
USA
BIOVIA Corporate Europe
BIOVIA
334 Cambridge Science Park,
Cambridge CB4 0WN
England
DS-8040-0914


