4.1(1)
MULTISIM DEMO 4.1: OPERATIONAL AMPLIFIERS IN MULTISIM
The Operational Amplifier is one of the more exciting components to work with in the study of
circuits. The guts of an op amp are rather complicated, but it seals up into a nice lumped
component which we can use to build some pretty useful circuits. This demo will introduce the
operational amplifier in Multisim.
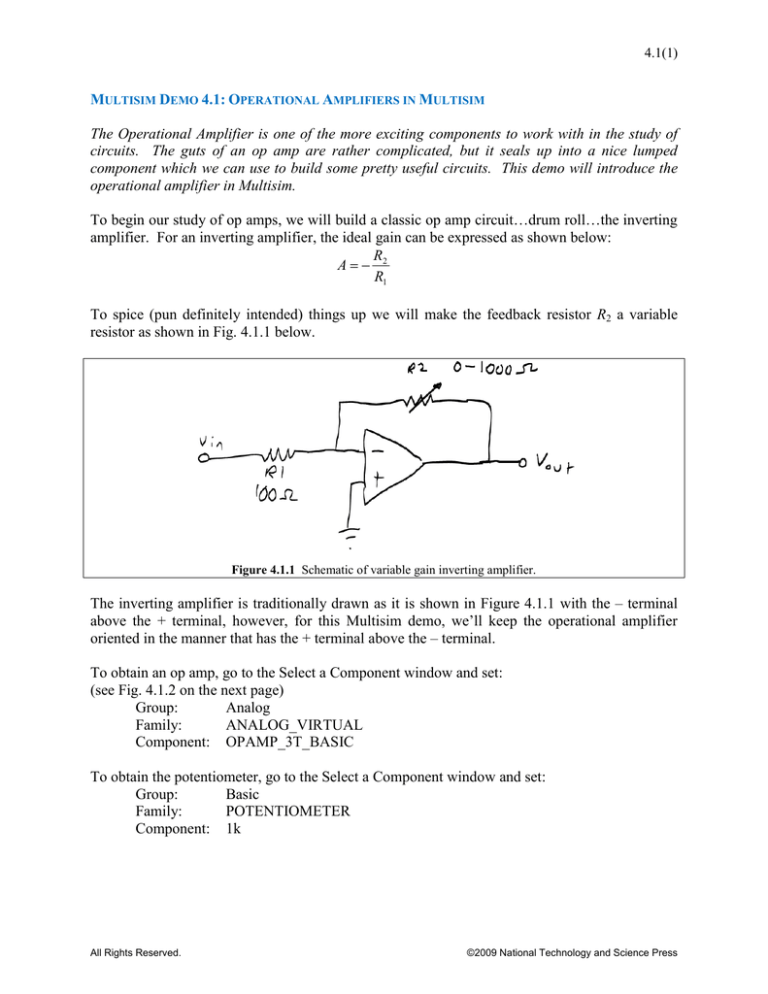
To begin our study of op amps, we will build a classic op amp circuit…drum roll…the inverting
amplifier. For an inverting amplifier, the ideal gain can be expressed as shown below:
R2
A
R1
To spice (pun definitely intended) things up we will make the feedback resistor R2 a variable
resistor as shown in Fig. 4.1.1 below.
Figure 4.1.1 Schematic of variable gain inverting amplifier.
The inverting amplifier is traditionally drawn as it is shown in Figure 4.1.1 with the – terminal
above the + terminal, however, for this Multisim demo, we’ll keep the operational amplifier
oriented in the manner that has the + terminal above the – terminal.
To obtain an op amp, go to the Select a Component window and set:
(see Fig. 4.1.2 on the next page)
Group:
Analog
Family:
ANALOG_VIRTUAL
Component: OPAMP_3T_BASIC
To obtain the potentiometer, go to the Select a Component window and set:
Group:
Basic
Family:
POTENTIOMETER
Component: 1k
All Rights Reserved.
©2009 National Technology and Science Press
4.1(2)
Figure 4.1.2 Select a Component window showing 3-terminal op amp.
Now let’s build the circuit. You’ll notice that when you place the 1 kΩ potentiometer, the arrow
angles to the left. This indicates that the percentage value visible tells us the resistance between
the top pin and the left pin of the potentiometer (see Fig. 4.1.3 below). Because of the
orientation of the inverting amplifier, we will need to vertically flip the potentiometer so that it
resembles the orientation shown in Figure 4.1.4 below. To do this you can right click on the
potentiometer and click on Flip Horizontal, or simply highlight the potentiometer and utilize the
key combination Alt-x. Once everything is put together your circuit should look like Fig. 4.1.4.
Make sure your potentiometer is oriented correctly and that it is set to 50%!
Figure 4.1.3 The intricacies of a potentiometer in Multisim.
Note: Alt-x flips horizontally while Alt-y flips vertically. For “non-chiral” components like
resistors, flipping the component on either axis does not actually change the component’s
symbol…flipping it is the same as rotating it several times in the appropriate direction. However
for “chiral” components such as an op amp, flipping will fundamentally change the symbol on
the schematic, and no amount of rotating will ever re-orient the symbol back to how it originally
was placed. Only flipping in the appropriate counter-direction will properly return it to its
original form. For example, when you flipped the potentiometer above, you will never be able to
rotate the potentiometer back to how it was originally. You will have to flip it again to cancel
the original flip.
All Rights Reserved.
©2009 National Technology and Science Press
4.1(3)
Figure 4.1.4 Variable-gain inverting amplifier built in Multisim.
So now we want to see what the output voltage is for a given input voltage. To do this let’s run
the DC Sweep Analysis.
To access the DC Sweep Analysis, go to Simulate>Analyses>DC Sweep…
or
Click on the arrow portion of the
Sweep…
button and then under the drop-down menu select DC
Figure 4.1.5 depicts the window which will appear.
Figure 4.1.5 DC Sweep Analysis window.
All Rights Reserved.
©2009 National Technology and Science Press
4.1(4)
Let’s swing the input voltage form -5 V to + 5 V. To do this:
1. Under the Analysis Parameters tab, set Source to vv1.
2. Set Start Value to -5 V.
3. Set Stop Value to 5 V.
4. Set increment to 0.01 V.
5. Click on the Output tab, place V(2) in the Selected variables for analysis field, just like
you would do for a DC Operating Point Analysis (see Fig. 4.1.6).
6. Under the Analysis Options tab, set the Title for Analysis to be “A = -5” (as shown in
Fig. 4.1.7).
7. Press Simulate.
Figure 4.1.6 Output tab of DC Sweep Analysis window.
Figure 4.1.7 Titling the Analysis “A = -5”.
All Rights Reserved.
©2009 National Technology and Science Press
4.1(5)
A window should appear similar to that shown in Fig. 4.1.8 below. This window is commonly
called the Grapher window. All Analyses that you will perform in Multisim display their results
in the Grapher window.
Figure 4.1.8 Output of Inverting Amplifier with A = -5.
Exit the Grapher window, and go back to the schematic. Adjust the potentiometer to 80%,
meaning the resistance between the arrow and the right side of the potentiometer is 800 Ω. What
we’ve just done is increase the magnitude of the gain of the amplifier…it is now -8. Repeat the
DC Sweep Analysis, but this time, set the Title for Analysis to be A = -8. Simulate. The result
should be similar to that in Fig. 4.1.9 below.
Figure 4.1.9 Output of Inverting Amplifier with A = -8.
All Rights Reserved.
©2009 National Technology and Science Press
4.1(6)
So we now have in our possession two output-vs-input plots, one for a gain of -5 and one for a
gain of -8. It would be really neat if we could put both of those plots on the same graph. Indeed
we can. At the top of the Grapher window on the toolbar, click on the Overlay Traces button,
. It will bring up the window shown in Fig. 4.1.10.
Figure 4.1.10 Select a Graph window with the A=-5 graph selected.
Note: Multisim stores previous Grapher plots, so if you have been doing a lot of simulation s
before you ran this simulation, your Select a Graph window may be full of a bunch of different
selections. To get rid of all of them, on the Grapher window go to Edit>Clear Pages and then in
the window which appears check all of the graphs you want throw out and Click OK. Make sure
you don’t throw out the Graph which has “A = -5” in it, however.
Select the graph (if there is more than one) which has “A = -5” somewhere in its title (see Fig.
4.1.10 for specific title) and then click on OK. The plot which results should resemble Fig.
4.1.11 shown below.
Figure 4.1.11 Combined output plots for both A = -5 and A = -8.
All Rights Reserved.
©2009 National Technology and Science Press
4.1(7)
Figure 4.1.11 allows us to compare the input-vs-output plots of the inverting amplifier with two
different gains. The steeper trace (red) corresponds to the gain of higher magnitude (-8). The
reason the two plots seem to level out above and below a certain input voltage is because the 3terminal op amp which we used of this circuit has a built-in output limit of +/-15 V. If the op
amp had an unlimited output range, then the traces would be simply two diagonal lines but
because of this limit, they level out at +/-15 V.
Making Pretty Graphs
Note: The parts below are optional, but helpful hints on how to make you have really nice graphs
since by default, the graphs produced by Multisim are readable, but primarily only on the
computer. If you have a need to use graphs produced by Multisim in a report, it will most likely
be necessary to change the colors and things to make them more aesthetically pleasing.
First off, if we want to present this graph in homework or something, graphs with black
backgrounds are totally hard to read and waste a lot of ink. To change this simply click on the
Reverse Colors button,
, found at the top of the Grapher tool bar. That automatically makes
the background white and changes the text and scale to black.
, also located at the top of the page. This
Now let’s click on the Page Properties button,
brings up the window shown in Fig. 4.1.12 below. Change the Tab Name to “A=-8/A=-5” and
change the Title to “Inverting Amplifier Gains.” Observe the changes to the Grapher window
and tabs.
Figure 4.1.12 Page Properties Graph.
Now let’s click on the Properties button,
, located at the top of the page. This brings up the
window shown in Fig. 4.1.13 on the next page. Under the Bottom Axis tab, change the Label to
“Input Voltage (V)”, and under the Left Axis tab, change the Label to “Output Voltage (V).”
Additionally, under the Traces tab, you can alter the properties of the traces. Use the Trace field
with the up and down arrow to select a specific trace to alter. For the green trace (Trace 2),
change the label to “A = -5” and increase Pen Size to 4 (see Fig. 4.1.14 on the next page). For
the red trace (Trace 1), change the label to “A = -8”, and increase the Pen Size to 4.
All Rights Reserved.
©2009 National Technology and Science Press
4.1(8)
While still in the Graph Properties window, under the General tab, set Grid to on. Click Apply
and then Click OK.
Figure 4.1.13 Renaming the Bottom Axis in the Graph Properties window.
Figure 4.1.14 Adjusting the properties of Trace 2.
Before looking at your beautiful graph, do one more thing: Click on the Show/Hide legend
button,
, at the top of the toolbar. Now your graph should look like Fig. 4.1.15.
All Rights Reserved.
©2009 National Technology and Science Press
4.1(9)
Figure 4.1.15 A very nice looking graph.
There are numerous other modifications you can make to your plots in order to turn them into
beautiful, easily readable documents to convey knowledge, and these general rules which we
have just gone over will apply to any Analysis which outputs signals into the Grapher View
window.
If I were a teacher grading late at night after not having eaten for ten hours and I came across the
graph shown in Figure 4.1.11, I would take off points because it is hard to read and poorly
labeled. But if I were given the graph shown in Fig. 4.1.15, I would not take off points. In fact, I
would probably give bonus points because it is so wonderful.
Nice graphs are one of the cornerstones of good engineering.
All Rights Reserved.
©2009 National Technology and Science Press


