Testing The CAPM
advertisement
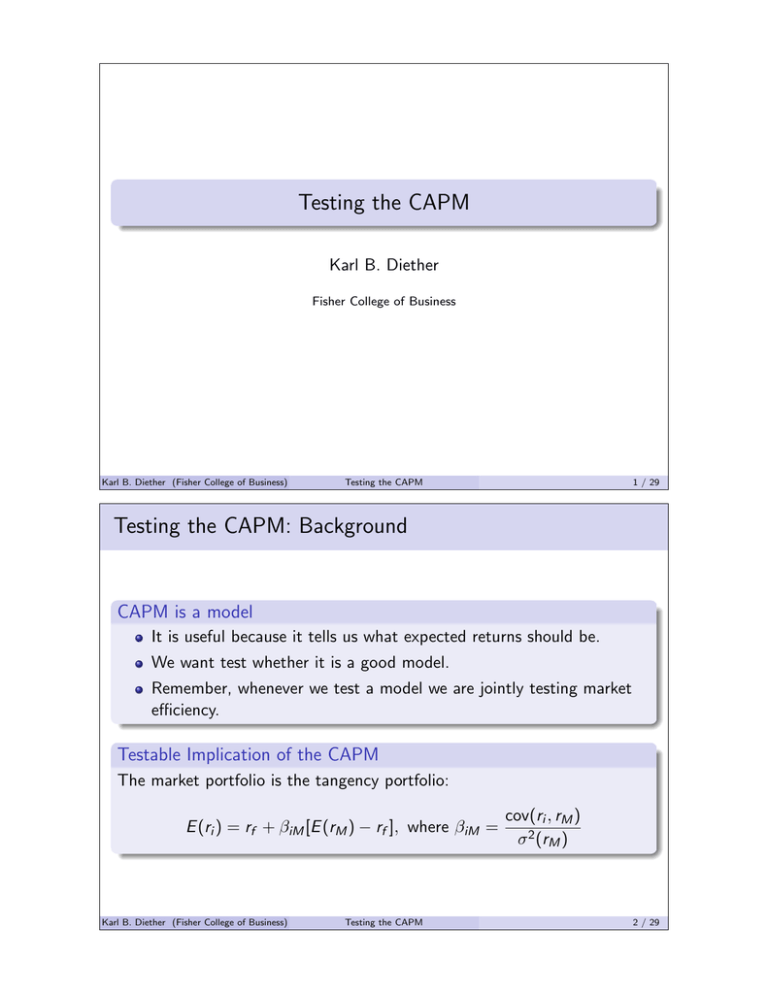
Testing the CAPM Karl B. Diether Fisher College of Business Karl B. Diether (Fisher College of Business) Testing the CAPM 1 / 29 Testing the CAPM: Background CAPM is a model It is useful because it tells us what expected returns should be. We want test whether it is a good model. Remember, whenever we test a model we are jointly testing market efficiency. Testable Implication of the CAPM The market portfolio is the tangency portfolio: E (ri ) = rf + βiM [E (rM ) − rf ], where βiM = Karl B. Diether (Fisher College of Business) Testing the CAPM cov(ri , rM ) σ 2 (rM ) 2 / 29 Testing the CAPM: The Approach Average Return vs CAPM Prediction The most common approach is two compare historical average returns to the CAPM’s prediction. We compute the CAPM’s estimated prediction by estimating beta (β), the market premium (E (rM ) − rf ), and the risk free rate (rf ). We want the estimated prediction error (called α̂): α̂i = r̄i − CAPM Prediction = r̄i − r̄f − β̂im (r̄M − r̄f ) The CAPM and α̂ α̂ will not always be zero even if the CAPM is true. Why? What can we say about prediction error if the CAPM holds? Karl B. Diether (Fisher College of Business) Testing the CAPM 3 / 29 A Good Strategy? Stock tip: Invest in mid-cap stocks. It is a good strategy because everyone ignores mid-cap stocks. Investor want blue chips, or they want to invest in small start-up companies with growth opportunities. Therefore, mid-cap stocks tend to be undervalued and have high returns on average. Testing Is this true? What do you think of this strategy? How can we test this empirically? How is this related to testing the CAPM? Karl B. Diether (Fisher College of Business) Testing the CAPM 4 / 29 Monthly Data: 2004-2005 Karl B. Diether (Fisher College of Business) Testing the CAPM 5 / 29 Monthly Data Description Variables rmid is the return on a portfolio composed of medium sized firms (mid-cap stocks). rM is the return on a proxy for the market portfolio (a value-weight index of all stocks on NYSE, AMEX, and Nasdaq). rf is proxy for the riskfree rate (one-month T-bill rate). Other data notes All returns are reported in percent per month. Karl B. Diether (Fisher College of Business) Testing the CAPM 6 / 29 Excess Returns Computing excess returns An excess return usually (but not always) refers to the return on a portfolio in excess of the riskfree rate: rp − rf Need excess returns for tests of the CAPM Need excess returns (or zero cost portfolios) to test the CAPM. Subtract off the riskfree rate (t-bill rate) from both the mid-cap portfolio and the market portfolio. Karl B. Diether (Fisher College of Business) Testing the CAPM 7 / 29 Monthly Data with Excess Returns: 2004-2005 Karl B. Diether (Fisher College of Business) Testing the CAPM 8 / 29 Estimation Issues How much data should we use? Are there ever circumstances where we should only use around 24 months of data? When can we use lots of past data? Does it ever make sense to use daily or annual data instead of monthly data? Generally we prefer to work with portfolios Why are portfolios usually superior to individual securities for tests? In general we like testing with portfolios formed on characteristics like market-cap, P/E, leverage, etc. Why? In general using industry or sector based portfolio can be problematic. Why? Karl B. Diether (Fisher College of Business) Testing the CAPM 9 / 29 Estimation Issues Other Problems Is it a problem that rM is a value-weight index of all stocks on NYSE, AMEX, and Nasdaq? What is the proxy missing? Karl B. Diether (Fisher College of Business) Testing the CAPM 10 / 29 Exploring the Data Always start with summary statistics Always check your summary statistics. Its a way to catch mistakes and get a “feel” for your data. In Excel use the average and stdev commands. Summary Statistics Mean Std. Dev. rmid 1.209 3.284 rM 0.836 2.468 rf 0.172 0.087 rmid − rf 1.037 3.280 rM − rf 0.665 2.463 What do the summary statistics tell us? What can we learn from the summary statistics about the mid-cap strategy or about the CAPM? Karl B. Diether (Fisher College of Business) Testing the CAPM 11 / 29 Estimating Sharpe Ratios Estimating Sharpe ratios: Method #1 ˆi= SR ˆ SR r̄i − r̄f σ̂(ri − rf ) Mid-Cap 0.316 Market 0.270 Estimating Sharpe ratios: Method #2 ˆ i = r̄i − r̄f SR σ̂(ri ) ˆ SR Karl B. Diether (Fisher College of Business) Mid-Cap 0.316 Testing the CAPM Market 0.269 12 / 29 Estimating Sharpe Ratios Which method is better? They are both fine. I will always use method #1: I prefer working with excess returns in both the numerator and denominator. The book uses method #2. Often they answers are the same out to 2-3 digits of precision. Graphing Sharpe ratios Compute the estimated CAL line: ˆ p σ̂(rp ) r̄p = r̄f + SR Karl B. Diether (Fisher College of Business) Testing the CAPM 13 / 29 Back to the Sharpe Ratios The estimated Sharpe ratios Mid-Cap 0.316 ˆ SR Market 0.270 Graphically Estimated CAL: Mid-Cap and Market Portfolio 1.9% 1.7% Average return 1.5% 1.3% 1.1% 0.9% 0.7% 0.5% 0.3% Mid-Cap Portfolio Market Portfolio 0.1% 0.5% Karl B. Diether (Fisher College of Business) 1% 1.5% 2% 2.5% 3% 3.5% Sample σ(r) Testing the CAPM 4% 4.5% 5% 5.5% 6% 14 / 29 Inferences and Estimated Sharpe Ratios What do the Sharpe ratios tell us? Can we infer that investing in mid-cap stocks is a good strategy based on the Sharpe ratios? Can we reject the CAPM based on the Sharpe ratios? Suppose, you don’t believe the CAPM is a good model, should you still estimate and examine Sharpe ratios? Weaknesses Are there any weaknesses to the Sharpe ratio approach? Karl B. Diether (Fisher College of Business) Testing the CAPM 15 / 29 Regression Regression A regression, least squares, or ordinary least squares fits a line through points. For example, we could regress the excess returns of an asset i on the excess returns of the market portfolio (M): rit − rft = αi + βiM (rMt − rft ) + it In the regression α refers to the intercept and β refers to the slope of the line We can’t perfectly fit the data with a line. We are working with random variables. it refers to the error term or how much an observation deviates from the line. Karl B. Diether (Fisher College of Business) Testing the CAPM 16 / 29 Regression What a regression does Regression minimizes the squared error: X min 2i α,β A regression picks α and β so that the squared error are a small as possible. This ensures that we get the best possible estimates of α and β. Karl B. Diether (Fisher College of Business) Testing the CAPM 17 / 29 Regression: Mid-Cap Stocks Relation: rmid and rM 7% 6% 5% 4% 3% rmid - rf 2% 1% 0% -1% -2% -3% -4% -5% -6% -7% -7% -6% -5% -4% -3% -2% -1% 0% 1% 2% 3% 4% 5% 6% 7% rM - rf Karl B. Diether (Fisher College of Business) Testing the CAPM 18 / 29 Regression: Mid-Cap Stock Relation: rmid and rM 7% 6% 5% 4% 3% rmid - rf 2% 1% βmid (1.305) is the slope 0% αmid (0.170) is the y-intercept -1% -2% -3% -4% -5% -6% -7% -7% -6% -5% -4% -3% -2% -1% 0% 1% 2% 3% 4% 5% 6% 7% rM - rf Karl B. Diether (Fisher College of Business) Testing the CAPM 19 / 29 Regression β and α Suppose we run the following regression: rit − rft = αi + βiM (rMt − rft ) + it The regressions estimate of β is the following: β̂iM = cov(r ˆ i − rf , rM − rf ) σ̂ 2 (rM − rf ) Thus we get the an appropriate estimate of beta from the regression. The regression estimate of α is the following for the regression: α̂i = r̄i − r̄f + β̂im (r̄M − r̄f ) = r̄i − CAPM Prediction Thus the regression also estimates the prediction error (often called model error). Karl B. Diether (Fisher College of Business) Testing the CAPM 20 / 29 What is the Regression Testing? The regression rit − rft = αi + βiM (rMt − rft ) + it Different ways of saying what the regression tests It tests whether the thing on the right hand side is the tangency portfolio. It tests whether the thing on the right-hand side has the highest possible Sharpe ratio. Specifically The intercept in this regression shows whether the right-hand side portfolio has the highest possible Sharpe ratio out of all possible portfolios consisting of the right-hand side variable, the left-hand side variable, and the risk free asset. Karl B. Diether (Fisher College of Business) Testing the CAPM 21 / 29 Alpha and Beta Synonyms for α and β α Intercept Constant Alpha a β Coefficient Slope Beta b Alpha The beta is interesting because it tells us about risk. Alpha is interesting because it tests if the market portfolio is the tangency portfolio. If the market portfolio is the tangency portfolio, then the estimated alpha should be zero (well, statistically indistinguishable from zero). Karl B. Diether (Fisher College of Business) Testing the CAPM 22 / 29 Regression Estimation Back to mid-cap stocks We want to run the following regression: rmidt − rft = αmid + βmidM (rMt − rft ) + it Critical data issue Your left hand and your right hand side variables must be excess returns (or zero cost portfolios). in this case: rmid − rf and rM − rf . If you don’t use excess returns (or a zero cost portfolio return) then your estimated α will be wrong. Karl B. Diether (Fisher College of Business) Testing the CAPM 23 / 29 Excel: The Regression Menu Excel: Data Analysis and Regression You can run a regression in Excel by going to the “Tools” menu and the “Data Analysis” sub-menu. Once you are in the “Data Analysis” sub-menu pick “Regression”. If the “Data Analysis” Sub-menu is not available go to “Add-Ins” in the “Tools” menu and add it. If you can’t add the “Data Analysis” Sub-menu use a lab computer for your homework. Excel needs the y-variable and x-variable In this case: y-variable = rmid − rf data. In this case: x-variable = rM − rf data. Karl B. Diether (Fisher College of Business) Testing the CAPM 24 / 29 Regression Results: rmidt − rft = αmid + βmidM (rMt − rft ) + it Results From Excel What can we infer? Can we reject the CAPM? Is investing in mid-cap stocks a good strategy? What parts of the regression should we be looking at? How do we asses statistical significance from the output? Karl B. Diether (Fisher College of Business) Testing the CAPM 25 / 29 The Security Market Line Estimating the SML The SML is just the CAPM equation: E (ri ) = rf + βiM (E (rM ) − rf ) Specifically the SML is a graph of expected return as a function a beta. To estimate we just need estimates of the riskfree rate and the expected return on the market: r̄i = r̄f + β̂im (r̄M − r̄f ) = 0.172 + β̂im 0.665 Karl B. Diether (Fisher College of Business) Testing the CAPM 26 / 29 The Estimated SML Estimated SML: 2003 1.5% 1.3% 1.1% Average return 0.9% 0.7% 0.5% 0.3% 0.1% -0.1% -0.3% -0.5% -0.7% -0.9% -0.8 -0.6 -0.4 -0.2 Karl B. Diether (Fisher College of Business) 0 0.2 0.4 0.6 0.8 1 Estimated βiM Testing the CAPM 1.2 1.4 1.6 1.8 2 27 / 29 The SML Regression and the SML What’s the difference between the estimated SML and the regression line? The SML and Alpha How is the estimated alpha and beta from our regression related to the estimated SML? Where would our results from the mid-cap portfolio show up on the graph? Karl B. Diether (Fisher College of Business) Testing the CAPM 28 / 29 Summary The testable implication of the CAPM is that the market portfolio is priced to be the tangency portfolio. We can test the CAPM with regression analysis rit − rft = αi + βiM (rMt − rft ) + it I I I If the CAPM holds, alpha will not be statistically different from zero. If the market portfolio is the tangency portfolio, alpha will not be statistically different from zero. If the p-value on the alpha is less than 0.05 then the alpha is statistically different from zero. Karl B. Diether (Fisher College of Business) Testing the CAPM 29 / 29

