Photonic crystal light deflection devices using the superprism effect
advertisement
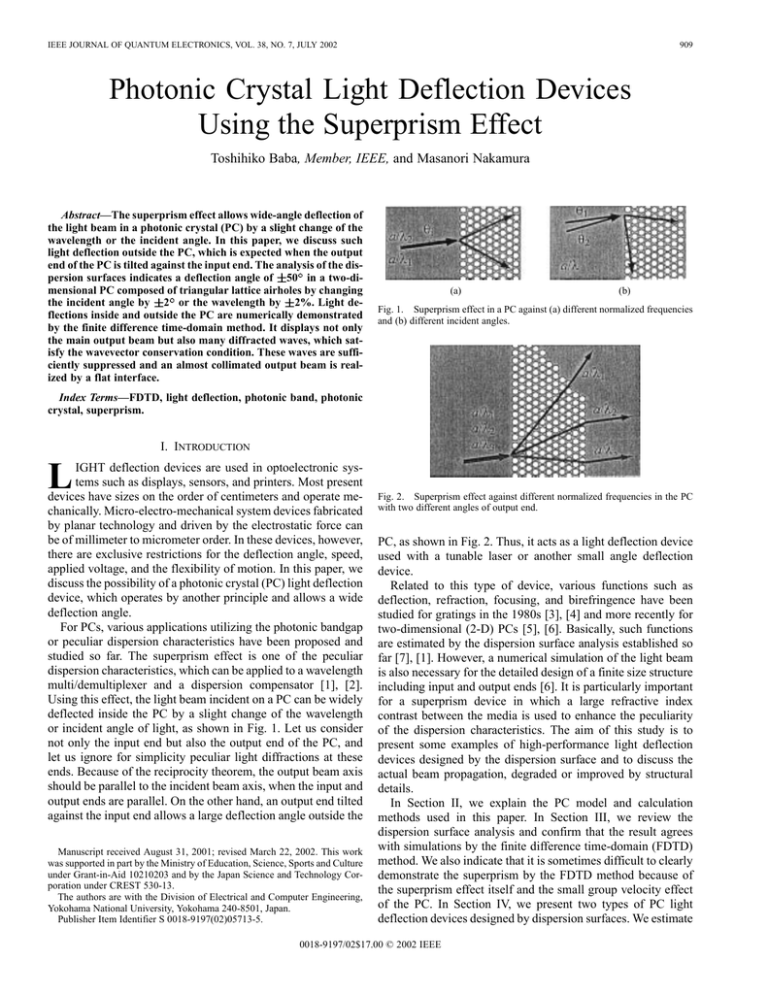
IEEE JOURNAL OF QUANTUM ELECTRONICS, VOL. 38, NO. 7, JULY 2002 909 Photonic Crystal Light Deflection Devices Using the Superprism Effect Toshihiko Baba, Member, IEEE, and Masanori Nakamura Abstract—The superprism effect allows wide-angle deflection of the light beam in a photonic crystal (PC) by a slight change of the wavelength or the incident angle. In this paper, we discuss such light deflection outside the PC, which is expected when the output end of the PC is tilted against the input end. The analysis of the dispersion surfaces indicates a deflection angle of 50 in a two-dimensional PC composed of triangular lattice airholes by changing the incident angle by 2 or the wavelength by 2%. Light deflections inside and outside the PC are numerically demonstrated by the finite difference time-domain method. It displays not only the main output beam but also many diffracted waves, which satisfy the wavevector conservation condition. These waves are sufficiently suppressed and an almost collimated output beam is realized by a flat interface. (a) (b) Fig. 1. Superprism effect in a PC against (a) different normalized frequencies and (b) different incident angles. Index Terms—FDTD, light deflection, photonic band, photonic crystal, superprism. I. INTRODUCTION L IGHT deflection devices are used in optoelectronic systems such as displays, sensors, and printers. Most present devices have sizes on the order of centimeters and operate mechanically. Micro-electro-mechanical system devices fabricated by planar technology and driven by the electrostatic force can be of millimeter to micrometer order. In these devices, however, there are exclusive restrictions for the deflection angle, speed, applied voltage, and the flexibility of motion. In this paper, we discuss the possibility of a photonic crystal (PC) light deflection device, which operates by another principle and allows a wide deflection angle. For PCs, various applications utilizing the photonic bandgap or peculiar dispersion characteristics have been proposed and studied so far. The superprism effect is one of the peculiar dispersion characteristics, which can be applied to a wavelength multi/demultiplexer and a dispersion compensator [1], [2]. Using this effect, the light beam incident on a PC can be widely deflected inside the PC by a slight change of the wavelength or incident angle of light, as shown in Fig. 1. Let us consider not only the input end but also the output end of the PC, and let us ignore for simplicity peculiar light diffractions at these ends. Because of the reciprocity theorem, the output beam axis should be parallel to the incident beam axis, when the input and output ends are parallel. On the other hand, an output end tilted against the input end allows a large deflection angle outside the Manuscript received August 31, 2001; revised March 22, 2002. This work was supported in part by the Ministry of Education, Science, Sports and Culture under Grant-in-Aid 10210203 and by the Japan Science and Technology Corporation under CREST 530-13. The authors are with the Division of Electrical and Computer Engineering, Yokohama National University, Yokohama 240-8501, Japan. Publisher Item Identifier S 0018-9197(02)05713-5. Fig. 2. Superprism effect against different normalized frequencies in the PC with two different angles of output end. PC, as shown in Fig. 2. Thus, it acts as a light deflection device used with a tunable laser or another small angle deflection device. Related to this type of device, various functions such as deflection, refraction, focusing, and birefringence have been studied for gratings in the 1980s [3], [4] and more recently for two-dimensional (2-D) PCs [5], [6]. Basically, such functions are estimated by the dispersion surface analysis established so far [7], [1]. However, a numerical simulation of the light beam is also necessary for the detailed design of a finite size structure including input and output ends [6]. It is particularly important for a superprism device in which a large refractive index contrast between the media is used to enhance the peculiarity of the dispersion characteristics. The aim of this study is to present some examples of high-performance light deflection devices designed by the dispersion surface and to discuss the actual beam propagation, degraded or improved by structural details. In Section II, we explain the PC model and calculation methods used in this paper. In Section III, we review the dispersion surface analysis and confirm that the result agrees with simulations by the finite difference time-domain (FDTD) method. We also indicate that it is sometimes difficult to clearly demonstrate the superprism by the FDTD method because of the superprism effect itself and the small group velocity effect of the PC. In Section IV, we present two types of PC light deflection devices designed by dispersion surfaces. We estimate 0018-9197/02$17.00 © 2002 IEEE 910 IEEE JOURNAL OF QUANTUM ELECTRONICS, VOL. 38, NO. 7, JULY 2002 (a) (b) Fig. 3. Analysis of the deflection angle by using dispersion surfaces. An iso-frequency curve of a= deflection in the PC and (b) outside the PC. = 0:64 is calculated for a PC with 2r=a = 0:8637. (a) Light a deflection angle of 50 by arranging various tilt angles of the output end. In Section V, we show an FDTD simulation indicating that not only the main light beam but also unwanted diffracted waves are excited at the output end. Here, we propose the flat interface and demonstrate that diffracted waves can be suppressed perfectly by this interface when the tilt angle of the output end is less than 10 . Finally, we show the simulation of the light deflecting function for different frequencies. Note that, in all figures in this paper, the primary direction of light propagation is drawn to be from the left to the right. In displaying light intensity distributions calculated by the FDTD, field data are moderately thinned out for saving the graphical resources of the computer. This sometimes causes peculiar Moiré patterns, which are changed by the data-thinning ratio. Therefore, we will use only the results for discussing the deflection angle of light beam, not details of field profiles, phases, etc. II. MODELS AND CALCULATIONS III. SUPERPRISM EFFECT In this paper, we assume a 2-D PC composed of triangular lattice circular airholes. The height and refractive index of airholes are infinite and 1.0, respectively. The index of the background medium is 3.065. This value is the modal index of a silicon on insulator slab [8], which is often used in experiments. In the is used as a structural parameter, where is following, the diameter of airholes and a is the lattice pitch. The frequency , where of light is expressed as the normalized frequency is the wavelength. The polarization of light is fixed so that the electric field vector lies inside the 2-D plane. A similar discussion will be possible for the orthogonal polarization. As shown in Fig. 1, the PC has an input end along the – direction of the Brillouin zone, and the incident light beam enters from the background medium to the PC with angle measured from the normal to the input end. The output end is tilted against the input end by angle . Here, the tilt angle is expressed by the step-like termination of the PC, as shown in Fig. 2. The output light beam also measured from is radiated out from the PC with angle the normal to the input end. Dispersion surfaces of the PC are calculated by the plane-wave expansion method reported by Ho et al. [9] with 313 plane waves. In the FDTD method, 60 Yee cells describe and pitch in the FDTD method are pitch . The diameter given so that the total area of one airhole described by Yee cells has the minimum difference to the airhole area assumed in the plane-wave expansion method. Berenger’s perfectly matched layer absorbing boundary condition of 64 layers is used for the termination of the analytical space. As the incident wave, a continuous sinusoidal wave is excited for the magnetic field normal to the 2-D plane. Fig. 3(a) shows an example of the iso-frequency curve F on a dispersion surface. By using this, the deflection angle of THE light beam inside the PC is predicted by the following dispersion surface analysis. First, we draw line S indicating the conservation of the tangential component of the incident wavevector at the input end. The vector from the point to the cross point of S and F is the wavevector in the PC. The gradient of the dispersion surface at this cross point corresponds to the direction of light propagation. There are no less than two symmetric cross points A and B. One of them can be determined by considering the direction of light propagation. Around the normalized frequency assumed in Fig. 3(a), the slope of the dispersion curve is negative against the length of the wavevector, i.e., the wavenumber. If one considers the forward propagating wave, point B should be selected, which gives the negative normal component of the wavevector but the positive slope of the dispersion surface. Fig. 4 shows the light intensity distribution simulated by the FDTD method. Arrows indicate directions of light deflection predicted by the dispersion surface. The light beam simulated by the FDTD almost agrees with this prediction. A small difference may be caused by the digital error in the FDTD method. The light intensity inside the PC depends on the normalized fre, but is 40%–50% of that before incidence. This dequency crease is caused by the reflection at the input end. Since the is relatively flat, light propiso-frequency curve at agating in the PC is highly collimated and the intensity along its propagating direction is almost constant. Since the curve at has four cross points with line S, two different deflection angles are predicted. However, the intensity is concen- BABA AND NAKAMURA: PHOTONIC CRYSTAL LIGHT DEFLECTION DEVICES USING THE SUPERPRISM EFFECT 911 (a) Fig. 4. Light intensity distributions calculated against normalized frequencies a= of (a) 0.55, (b) 0.61, (c) 0.65, and (d) 0.70 by the FDTD method. Open circles are added to indicate the position of airholes. 2r=a = 0:8637 and = 5 . trated in the main beam, and the intensity along the propagating , the cross point direction is kept almost constant. At cannot be defined clearly so that a sufficient light intensity is , the interval between not observed in the PC. At the curves is wide. This means a small group velocity inside the PC. Therefore, the reflection at the input end is remarkable and only 30% of light enters the PC. In addition, the intensity decays gradually along the propagating direction, since the light beam largely expands as it propagates. In this FDTD calculation, the incident beam width was deterdue to the restriction of the total size of the anmined to be alytical space. Since the normalized frequency range focused on 0.5–0.8, the beamwidth is – . This corin this paper is responds to 10 times the diffraction limit in vacuum ( 30 times that in the background medium). However, the incident beam still includes angled plane-wave components to some extent. The superprism effect and the small group velocity effect scatter these components to various directions, expand the propagating beam, and generating some irregular beams. Actually, however, it is easy to expand the incident beamwidth to, for example, 100 times the diffraction limit and reduce such angled components in experiments. Therefore, we think that the beam quality and the power efficiency will not be actual problems. The reflection loss is another problem to be managed. Regarding this, we reported some structural modifications of the input end, which reduce the reflection to a negligible order in another paper [10]. IV. DEVICE DESIGN BY DISPERSION SURFACES Fig. 3(b) shows the analysis of the deflection of the output beam, when the output end of the PC is tilted by angle . The light propagating in the PC reaches the output end without losing the wavevector excited at the input end. The deflection angle can be determined by considering the conservation condition of the wavevector at the output end. In a manner similar to that at the (b) Fig. 5. PC light deflection devices designed by dispersion surfaces. (a) Device operated by a slight change of normalized frequency and (b) that by a slight change of incident angle. The left side shows the analysis of the deflection angle in the PC and the right side shows the profile of the designed device. input end, the cross point of line S and the iso-frequency curve of the output beam in the background medium is investigated. Since S is changed by angle , the deflection outside the PC can be controlled by angle . For a wide deflection by a slight change of frequency, an iso-frequency curve should be selected, which shows a rapid change in the dispersion characteristic. On the other hand, for a wide deflection by a slight change of the incident angle, an iso-frequency curve with a complex shape should be selected. Fig. 5(a) and (b) shows examples of a designed device. with wavenumbers The change of the normalized frequency 0.530–0.550 assumed in Fig. 5(a), while is negative when [assumed in Fig. 5(b)]. The maximum it is positive at deflection angle of 50 is designed by considering these properties. The device in Fig. 5(a) allows such a wide deflection 43 10 and a 2% change of the by the combination of normalized frequency. The device in Fig. 5(b) allows this by 72 63 and a 2 change of the incident angle. We designed these devices so that they exhibit a value of as large as possible. However, a remarkable deflection generally causes many diffracted waves of the output beam, as discussed in Section V. Actual light deflection devices are not always required to have such a large . If the number of resolution points is important, a dispersion surface that moderately suppresses the superprism effect should be selected. We will discuss this issue elsewhere [11]. V. DEVICE SIMULATION BY THE FDTD METHOD In Section IV, we simply estimated the light deflection using the wavevector conservation condition at the output end. 912 IEEE JOURNAL OF QUANTUM ELECTRONICS, VOL. 38, NO. 7, JULY 2002 (a) (b) Fig. 6. Analysis of the deflection angle of the output beam. Line S is shifted so that the wavevector conservation condition at the output end is explained. 2r=a = 0:8637; a= = 0:55, and = 0 . (a) = 0 . (b) 10 . Solid and dashed arrows indicate the main beam and diffracted waves, respectively. (a) (b) Fig. 7. Calculation models and light intensity distributions of output beam calculated by the FDTD method. Parameters are the same as for Fig. 6. Solid and dashed arrows indicate main beam and diffracted waves, respectively. Light intensity distribution of the output beam when (a) and are 0 and (b) = 10 . However, the PC has an infinite number of reciprocal lattice vectors that shift the conservation condition. This actually excites many diffracted waves with various deflection angles. Fig. 6 explains the analysis of such waves. Since copies of line S shifted by reciprocal lattice vectors generate many cross points with the iso-frequency curve of the output beam in the background medium, many extra wavevectors also satisfy the conservation condition. When and are 0 , three different wavevectors are predicted, as shown in Fig. 6(a). When the output end is tilted, many wavevectors with different are predicted, as shown in Fig. 6(b). These predictions are confirmed in the FDTD simulation. Fig. 7(a) shows the light intensity distribution of the output beam, when and are 0 . The solid arrow indicates the direction of deflection predicted from the unshifted line S , and dashed arrows indicate extra directions predicted from the shifted lines. Deflection angles simulated by the FDTD method almost agree with the . prediction. Fig. 7(b) shows the output beam when In this case, six lines shifted by the smallest reciprocal lattice vectors are considered for the prediction of deflection angles. In a manner similar to Fig. 7(a), many diffracted waves are excited, and the deflection of the main beam is not clear. In general, diffracted waves become more dominant when the tilt angle is enlarged. Various structural modifications of the output end are considered for clearer light deflection. The FDTD simulation indicates that the output end with the flat interface, which is composed of rectangular airholes connected by circular airholes, improves the problem. Fig. 8(a) shows the light intensity distribution for 0 . The diffracted waves are remarkably suppressed and the main beamis well collimated. The intensity of the output beam is 70% of that in the PC. This value indicates that most of the light not af- BABA AND NAKAMURA: PHOTONIC CRYSTAL LIGHT DEFLECTION DEVICES USING THE SUPERPRISM EFFECT 913 (a) (b) Fig. 8. Calculation models and light intensity distributions of the output beam from the PC with a flat interface calculated by the FDTD method. The parameters are the same as those in Fig. 6. Length b of the rectangular airholes [the longest length for (b)] is four times the diameter 2r of the circular airholes. Solid and dashed arrows indicate the main beam and diffracted waves, respectively. Light intensity distribution for (a) = 0 and (b) = 10 . fected by Fresnel reflection at the interface is collected into this main beam. The effectiveness of the flat interface is not sensitive to length of the rectangular airholes; an almost similar result is expected, when the PC is terminated by half circles. For these results, two reasons are considered. One is the less effective excitation of angled diffracted waves by the flat interface. The other is that the rectangular airholes change the shifting condition of line S and reduce the number of cross points between the shifted lines and the iso-frequency curve outside the PC. Fig. 8(b) shows the re10 . Here, the rectangular airholes are oriented in the sult for direction of deflection predicted by the dispersion surface. Two rectangular airholes at each step-like arrangement of circular airholes are overlapping. The length of each rectangular airhole is adjusted so that the output end is on a straight line parallel to the output end of the PC. Therefore, the straight line is not necessarily normal to the orientation of the rectangular airholes. The simulated main beam is oriented in almost toward the same direction as that predicted by the dispersion surface. Even with the flat interface, the diffracted waves are gradually increased by a larger tilt angle . To sufficiently suppress the diffracted waves, should be less than 10 . Fig. 9(a)–(c) shows light intensity distributions when assuming three different tilt angles and three different normalized frequencies. Flat interfaces are designed in the same way as for Fig. 8(b). The light deflecting function is observed, which is well explained by dispersion curves. However, some noisy distributions and the remarkable expansion of the light beam are also observed. One reason is the Moiré pattern, as explained . in Section II. However, they too are evident at This must be caused by the influence of the finite width of the incident beam and the small group velocity effect, as explained in Section III. On the other hand, Fig. 10(a)–(c) shows the light Fig. 9. Calculation model and light deflecting function of a PC with tilted flat interfaces simulated by the FDTD method. 2r=a = 0:8637, = 6 and = 30 , 0 and 30 . Normalized frequency a= is (a) 0.55, (b) 0.61, and (c) 0.70. 0 deflecting function, when air is assumed outside the output end of the PC. Here, three different normalized frequencies are selected so as to avoid the small group velocity effect. In this calculation, clearer light deflections are observed, as compared with those in Fig. 9(a)–(c). This seems to be due to the small iso-frequency curve outside the PC, which reduces the cross points of the shifted lines and the iso-frequency curve. 914 IEEE JOURNAL OF QUANTUM ELECTRONICS, VOL. 38, NO. 7, JULY 2002 REFERENCES Fig. 10. Calculation model and light deflecting function of a PC with tilted flat interfaces simulated by the FDTD method. Structural parameters are the same as those for Fig. 9, except that air with an index of 1.0 is assumed outside the flat interfaces. Length b is 4 times the diameter 2r of the circular airholes. The normalized frequency a= is (a) 0.56, (b) 0.66, and (c) 0.75. [1] H. Kosaka, T. Kawashima, A. Tomita, M. Notomi, T. Tamamura, T. Sato, and S. Kawakami, “Superprism phenomena in photonic crystals,” Phys. Rev. B, vol. 58, pp. 10 096–10099, 1998. [2] , “Photonic crystals for micro lightwave circuits using wavelength-dependent angular beam steering,” Appl. Phys. Lett., vol. 74, pp. 1370–1372, 1999. [3] P. St. J. Russell, “Novel thick-grating beam-squeezing device in Ta O corrugated planar waveguide,” Electron. Lett., vol. 20, pp. 72–73, 1984. [4] R. Zengerle, “Light propagation in singly and doubly periodic planar waveguides,” J. Mod. Opt., vol. 34, pp. 1589–1617, 1987. [5] P. Halevi, A. A. Krokhin, and J. Arriaga, “Photonic crystal optics and homogenization of 2D periodic composites,” Phys. Rev. Lett., vol. 82, pp. 719–722, 1999. [6] B. Gralak, S. Enoch, and G. Tayeb, “Anomalous refractive properties of photonic crystals,” J. Opt. Soc. Amer. A, vol. 17, pp. 1012–1020, 2000. [7] P. St. J. Russell and T. B. Birks, “Bloch wave optics in photonic crystals: Physics and applications,” in Photonic Band Gap Materials, C. M. Soukoulis, Ed. Boston, MA: Kluwer, 1996, pp. 71–92. [8] T. Baba, N. Fukaya, and A. Motegi, “Clear correspondence between theoretical and experimental light propagation characteristics in photonic crystal waveguides,” Electron. Lett., vol. 37, pp. 761–762, 2001. [9] K. M. Ho, C. T. Chan, and C. M. Soukoulis, “Existence of a photonic band gap in periodic structures,” Phys. Rev. Lett., vol. 65, pp. 3152–3155, 1990. [10] T. Baba and D. Ohsaki, “Interfaces of photonic crystals for high efficiency light transmission,” Jpn. J. Appl. Phys., vol. 40, pp. 5920–5924, 2001. [11] T. Baba and T. Matsumoto, private communication, unpublished. VI. CONCLUSION We proposed a PC light deflection device, which operates by the superprism effect and a tilt of the input and output ends of the PC. In the design of this device using dispersion surfaces, the deflection of the output beam of 50 was predicted for a change of the frequency by 2% or for the incident angle by 2 . The superprism effect inside the PC, which was predicted by dispersion surfaces, agreed well with those simulated by the FDTD method. However, the FDTD simulation indicated that the quality of the output beam was seriously affected by diffracted waves. To suppress such waves, we proposed the flat interface at the output end of the PC, and confirmed its effectiveness in the simulation. We also confirmed the light deflecting function in such devices in the FDTD simulation. A slight change of the incidence angle widely deflects the light beam in the PC, but it largely expands the output beam too. The number of resolution points of the incident light beam is not essentially improved. On the other hand, the frequency change can be a driving mechanism of deflecting a light beam. Therefore, a compact light deflection system will be possible by a combination of the PC light deflection device and a tunable laser. ACKNOWLEDGMENT The authors would like to thank Prof. Y. Kokubun, Yokohama National University, and Prof. K. Iga and Prof. F. Koyama, Tokyo Institute of Technology, for helpful suggestions. Toshihiko Baba (M’93) was born in Nagano Prefecture, Japan, in 1962. He received the B.E., M.E., and Ph.D. degrees from the Division of Electrical and Computer Engineering, Yokohama National University, Japan, in 1985, 1987, and 1990, respectively. During his Ph.D. work, he was engaged in antiresonant reflecting optical waveguides (ARROWs) and integrated lightwave circuits. In 1990, he joined the Precision and Intelligence Laboratory, Tokyo Institute of Technology, Tokyo, Japan, as a Research Associate. In 1991, he reported the first calculation of spontaneous emission phenomena in microcavity vertical-cavity surface-emitting lasers (VCSELs). In 1993, he achieved the first room-temperature CW operation of a long-wavelength VCSEL. In 1994, he became an Associate Professor with Yokohama National University, Yokohama, Japan. From 1996 to 1997, he reported the lasing of a microdisk injection laser with the smallest cavity, the proposal and the first lasing of a deep grating distributed feedback laser, and fabrication and the first observation of light emission characteristics of photonic crystals. In 1999, he succeeded in demonstrating a photonic crystal waveguide operating at lightwave frequencies for the first time. Now his research interests are geared toward the spontaneous emission control in microdisk lasers and various device applications based on semiconductor photonic crystals. Dr. Baba is a member of the Institute of Electronics, Information and Communication Engineers (IEICE), the Japan Society of Applied Physics, and the American Physics Society. He received the Niwa Memorial Prize in 1991, the Best Paper Award of Micro-Optic Conference in 1993 and 1999, the Paper Award and Academic Encouragement Award from IEICE in 1994, and the Marubun Research Encouragement Award in 2000. Masanori Nakamura was born in Tokyo, Japan, in 1978. He received the B.E. degrees from the Division of Electrical and Computer Engineering, Yokohama National University, Japan, in 2001. He is currently working toward the M.E. degree at the Tokyo Institute of Technology, Tokyo, Japan. Mr. Nakamura is a member of the Japan Society of Applied Physics.
