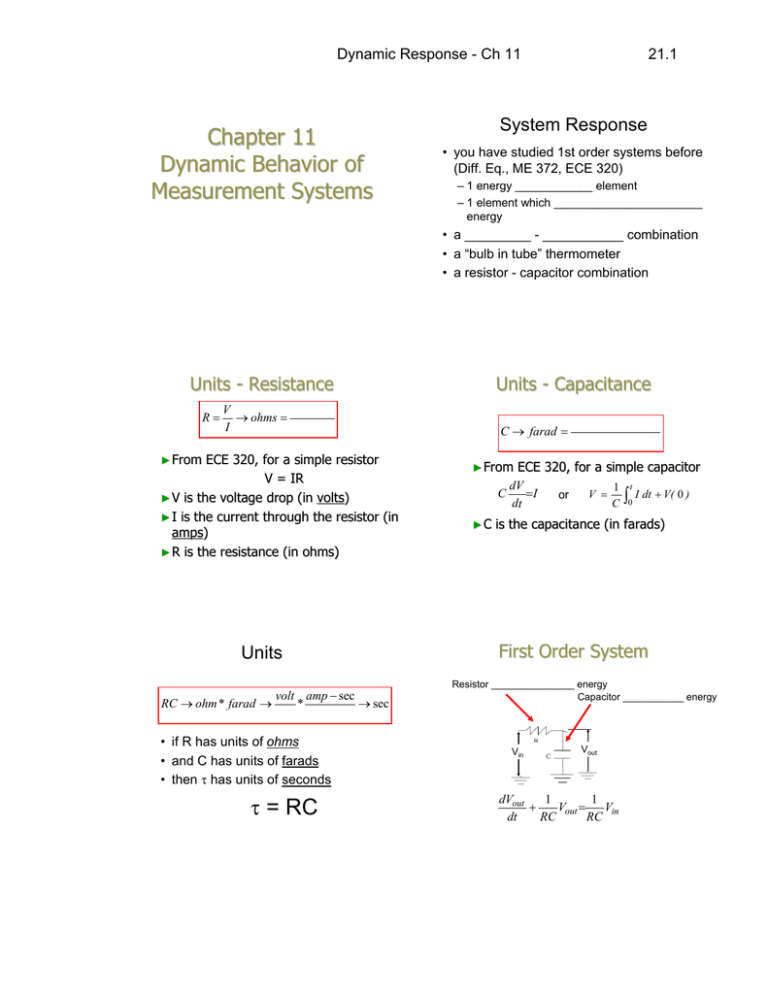
Chapter 11 Dynamic Behavior of Measurement Systems τ = RC
advertisement

Dynamic Response - Ch 11 Chapter 11 Dynamic Behavior of Measurement Systems 21.1 System Response • you have studied 1st order systems before (Diff. Eq., ME 372, ECE 320) – 1 energy ____________ element – 1 element which _______________________ energy • a _________ - ___________ combination • a “bulb in tube” thermometer • a resistor - capacitor combination Units - Resistance R Units - Capacitance V ohms I ► From ECE 320, for a simple resistor V = IR ► V is the voltage drop (in volts) volts) ► I is the current through the resistor (in amps) amps) ► R is the resistance (in ohms) Units volt amp sec RC ohm * farad * sec • if R has units of ohms • and C has units of farads • then has units of seconds = RC C farad ► From ECE 320, for a simple capacitor dV C I dt ►C or V 1 C t 0 I dt V( 0 ) is the capacitance (in farads) First Order System Resistor _______________ energy Capacitor ___________ energy Vin Vout dVout 1 1 Vout Vin RC RC dt Dynamic Response - Ch 11 System Response ► Equation System Response for a “generic” 1st order system: ► Solution by where y = dependent variable (velocity, voltage, …) for a step (constant) input is given where ► = time constant ► f(t) = forcing function (input) ► 1st Order System Step Response Characteristics y is the limiting or final (steady(steady-state) value y0 is the initial value at t=0 is the time constant (units of seconds) 1st Order System Step Response Characteristics = 80 units ► y0 = 20 units ► at t = (one time constant), ► Response will be _________% closer to the final value after 1 time constant, ► y 100 80 y 20 0.632 80 20 _______ 60 40 20 Estimate the time constant from the graph 0 0 1 2 3 4 5 Time, t (seconds) 100 Output, P Output, P 21.2 80 60 40 20 0 0 1 2 3 Time, t (seconds) 4 5 Dynamic Response - Ch 11 1st Order System Step Response Characteristics will be 63.2% closer to the final value after 1 time constant, Output, P ► Response 1st Order System Step Response Characteristics ► y = -60 units ► y0 = 40 units ► at 40 30 20 10 0 -10 -20 -30 -40 -50 -60 21.3 t = (one time constant), y 40 0.632 (60) 40 _________ 0 0.2 0.4 0.6 0.8 1 Estimate the time constant from the graph 1.2 Time, t 1st Order System Step Response Characteristics line tangent to the response at t = 0 will intersect the final value at t = Output, P ►A 40 30 20 10 0 -10 -20 -30 -40 -50 -60 0 0.2 0.4 0.6 0.8 1 Output, P Time, t 40 30 20 10 0 -10 -20 -30 -40 -50 -60 0 0.2 0.4 0.6 Time, t 0.8 1 1.2 1.2 Dynamic Response - Ch 11 RC Time Constant Theoretical Time Constant 4 Vin 3 + Ei Vout 2 1 Volts 21.4 R + Eo i C - - a) What is the theoretical time constant, RC, if R = 47 k in parallel with 22 k, C = 0.01 F? 0 b) Sketch the response of the system (Eo) if Ei is a step input from -3 volts to +9 volts (y0=-3V, y∞=+9V), be sure to label both axes of your sketch! Input Output -1 -2 -3 0 0.02 0.04 0.06 0.08 0.1 Time, sec 1st Order System - Harmonic Response ► at What if you give a 1st order system a sinusoidal (harmonic) input? “low” frequencies, dy 1 y yi sin t dt Output, P where yi = amplitude of input = frequency of input 2.5 2 1.5 1 0.5 0 -0.5 -1 -1.5 -2 -2.5 0 0.2 0.4 0.6 0.8 1 Time, t 5 Input and Output, volts 4 3.5 Is there any Input uncertainty Output in the time constant, ? 2 1.5 1 0.5 0 0.00 0.02 0.04 0.06 0.08 Time, sec 0.10 0.12 0.14 2.5 2 1.5 1 0.5 0 -0.5 -1 -1.5 -2 -2.5 0 0.2 0.4 0.6 0.8 1 1.2 Time, t y ( ) y y0 y e / 4.70 1.25 4.70 e 1 3.43 4.5 3 1.2 “high” frequencies Uncertainty in Time Measurements Determine Time Constant from Experimental Data 2.5 ► at Output, P 1st Order System - Harmonic Response 0.16 Time sec 0.024 0.025 Input volts 1.25 4.70 Output volts 1.25 1.25 0.026 : 0.056 0.057 4.70 : 4.70 4.70 1.36 : 3.39 3.42 0.058 4.70 3.47 Dynamic Response - Ch 11 Spring - Mass - Damper 2nd Order System Response ► Typical 2nd order systems f(t) +v 2 energy storing elements ►must 21.5 +x (measured from static equilibrium position) M store ________________________ of energy! 1 element which dissipates (or removes) energy ________ - ______ - damper combination ► a resistor - ________ - capacitor (RLC) combination x v ►a 2nd Order System 1 Kx Bx f (t ) M x x x y 2 where: 1 x f(t ) M 1 x f(t ) M Mechanical Oscillation 1N s 2 X kg kg m y F (t ) K natural frequency M Mechanical Oscillation ,m Units of mass: kg y B damping ratio 2 MK n ,k Units of spring stiffness: N/m N k m 2 m N s m 1 Kx Bv f (t ) M “Generic” 2nd order system: Rearrange the equation above, x v Generic 2nd Order System Substitute the definition for v into the second equation, v x B K ,m Units of weight: lb W mg m W g ,k Units of spring stiffness: lb/in k m Frequency in lb k in 1 m lb s 2 k k m W g lb in lb in s2 1 s2 Dynamic Response - Ch 11 2nd Order Systems ► Three 2.0 possible solutions: 21.6 2nd Order System Response Theoretical response - continuous 1.5 1.0 Output, y 2 distinct, real roots 2 repeated, real roots 2 complex conjugate roots 0.5 0.0 -0.5 -1.0 -1.5 -2.0 0.0 0.2 0.4 0.6 0.8 1.0 Time, sec 2.0 2nd Order System Response Measured response -___________________ 1.5 Output, y 1.0 0.5 0.0 -0.5 -1.0 -1.5 -2.0 0.0 0.2 0.4 0.6 0.8 1.0 Time, sec Time sec ¦ 0.13 0.14 0.15 0.16 0.17 0.18 0.19 0.2 ¦ 0.79 0.8 0.81 0.82 0.83 0.84 0.85 0.86 ¦ Time sec ¦ 0.13 0.14 0.15 0.16 0.17 0.18 0.19 0.2 ¦ 0.79 0.8 0.81 0.82 0.83 0.84 0.85 0.86 ¦ Data from SignalExpress Output volts ¦ 0.514 1.110 1.542 1.752 1.715 1.440 0.968 0.368 ¦ 0.034 0.434 0.768 0.989 1.069 0.999 0.791 0.475 ¦ “0” peak between 0.15 sec & 0.17 sec Data from SignalExpress Output volts ¦ 0.514 1.110 1.542 1.752 1.715 1.440 0.968 0.368 ¦ 0.034 0.434 0.768 0.989 1.069 0.999 0.791 0.475 ¦ “0” peak at T0~0.16 sec “4” peak at T4~0.83 sec Uncertainty Analysis n d u T4 T0 0 - 4cycles- 1 T0 T4 T0 2 “4” peak between 0.82 sec & 0.84 sec 2 - 4cycles T4 4cycles uT uT T0 T4 T0 2 4cycles 0 2 uT0 uT4 T0 T4 4 cycles T4 T0 0 T T 0 4 uT T4 T4 T0 4 Dynamic Response - Ch 11 2nd Order System Response – Log Decrement 2.0 Estimate of Damping Ratio, , from “Log Decrement” Log decrement, , is the natural log (ln) of the ratio of two successive “peak-to-peak” amplitudes : 1.5 1.0 An log decrement A n 1 0.5 ln 0.0 -0.5 Damping ratio, , can be estimated from: -1.0 -1.5 -2.0 0.0 0.2 0.4 0.6 0.8 4 2 2 1.0 Time, sec Time sec ¦ 0.32 0.33 0.34 ¦ 0.40 0.41 0.42 ¦ 0.49 0.50 0.51 ¦ 0.57 0.58 0.59 In-Class Exercise Data from SignalExpress Output volts ¦ 1.444 1.559 1.455 ¦ -1.275 -1.451 -1.421 ¦ 1.328 1.365 1.212 ¦ -1.195 -1.291 -1.205 Work in groups of two students to find the natural frequency and the damping ratio from this 2nd order system response: 3.0 2.0 An = 1.559-(-1.451) = 3.010 1.0 Output, y Output, y 21.7 0.0 -1.0 An+1 = 1.365-(-1.291) = 2.656 -2.0 -3.0 0.00 0.25 0.50 0.75 1.00 Time, sec 1.25 1.50 1.75 2.00

