Reliability cost/worth assessment of distribution systems
advertisement
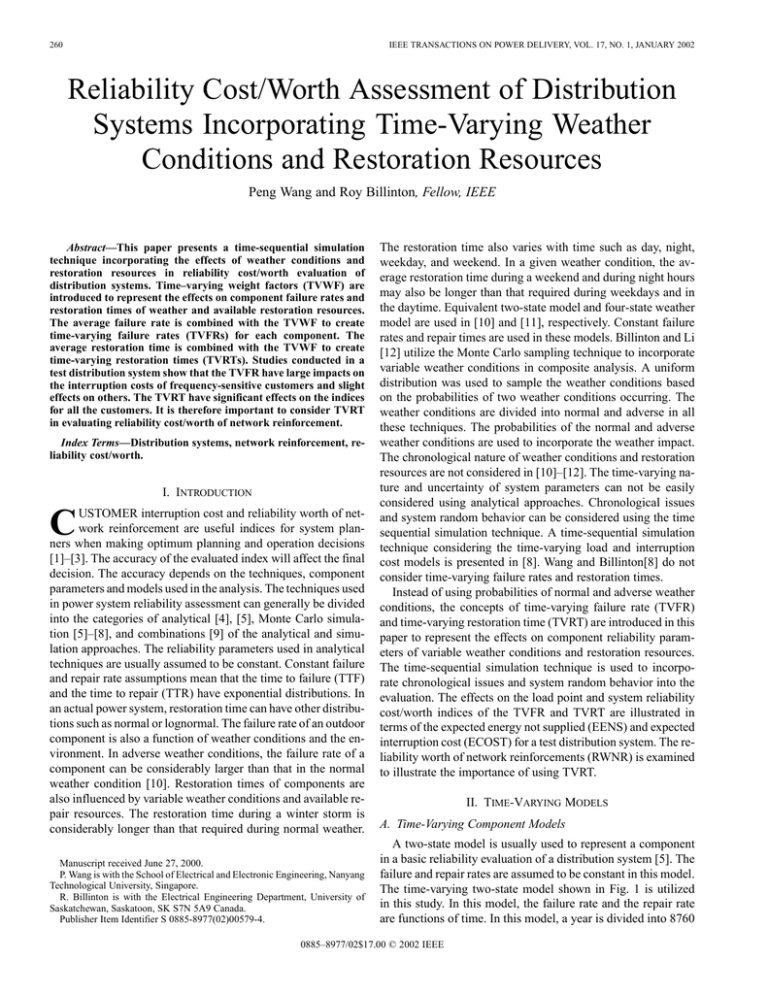
260 IEEE TRANSACTIONS ON POWER DELIVERY, VOL. 17, NO. 1, JANUARY 2002 Reliability Cost/Worth Assessment of Distribution Systems Incorporating Time-Varying Weather Conditions and Restoration Resources Peng Wang and Roy Billinton, Fellow, IEEE Abstract—This paper presents a time-sequential simulation technique incorporating the effects of weather conditions and restoration resources in reliability cost/worth evaluation of distribution systems. Time–varying weight factors (TVWF) are introduced to represent the effects on component failure rates and restoration times of weather and available restoration resources. The average failure rate is combined with the TVWF to create time-varying failure rates (TVFRs) for each component. The average restoration time is combined with the TVWF to create time-varying restoration times (TVRTs). Studies conducted in a test distribution system show that the TVFR have large impacts on the interruption costs of frequency-sensitive customers and slight effects on others. The TVRT have significant effects on the indices for all the customers. It is therefore important to consider TVRT in evaluating reliability cost/worth of network reinforcement. Index Terms—Distribution systems, network reinforcement, reliability cost/worth. I. INTRODUCTION C USTOMER interruption cost and reliability worth of network reinforcement are useful indices for system planners when making optimum planning and operation decisions [1]–[3]. The accuracy of the evaluated index will affect the final decision. The accuracy depends on the techniques, component parameters and models used in the analysis. The techniques used in power system reliability assessment can generally be divided into the categories of analytical [4], [5], Monte Carlo simulation [5]–[8], and combinations [9] of the analytical and simulation approaches. The reliability parameters used in analytical techniques are usually assumed to be constant. Constant failure and repair rate assumptions mean that the time to failure (TTF) and the time to repair (TTR) have exponential distributions. In an actual power system, restoration time can have other distributions such as normal or lognormal. The failure rate of an outdoor component is also a function of weather conditions and the environment. In adverse weather conditions, the failure rate of a component can be considerably larger than that in the normal weather condition [10]. Restoration times of components are also influenced by variable weather conditions and available repair resources. The restoration time during a winter storm is considerably longer than that required during normal weather. Manuscript received June 27, 2000. P. Wang is with the School of Electrical and Electronic Engineering, Nanyang Technological University, Singapore. R. Billinton is with the Electrical Engineering Department, University of Saskatchewan, Saskatoon, SK S7N 5A9 Canada. Publisher Item Identifier S 0885-8977(02)00579-4. The restoration time also varies with time such as day, night, weekday, and weekend. In a given weather condition, the average restoration time during a weekend and during night hours may also be longer than that required during weekdays and in the daytime. Equivalent two-state model and four-state weather model are used in [10] and [11], respectively. Constant failure rates and repair times are used in these models. Billinton and Li [12] utilize the Monte Carlo sampling technique to incorporate variable weather conditions in composite analysis. A uniform distribution was used to sample the weather conditions based on the probabilities of two weather conditions occurring. The weather conditions are divided into normal and adverse in all these techniques. The probabilities of the normal and adverse weather conditions are used to incorporate the weather impact. The chronological nature of weather conditions and restoration resources are not considered in [10]–[12]. The time-varying nature and uncertainty of system parameters can not be easily considered using analytical approaches. Chronological issues and system random behavior can be considered using the time sequential simulation technique. A time-sequential simulation technique considering the time-varying load and interruption cost models is presented in [8]. Wang and Billinton[8] do not consider time-varying failure rates and restoration times. Instead of using probabilities of normal and adverse weather conditions, the concepts of time-varying failure rate (TVFR) and time-varying restoration time (TVRT) are introduced in this paper to represent the effects on component reliability parameters of variable weather conditions and restoration resources. The time-sequential simulation technique is used to incorporate chronological issues and system random behavior into the evaluation. The effects on the load point and system reliability cost/worth indices of the TVFR and TVRT are illustrated in terms of the expected energy not supplied (EENS) and expected interruption cost (ECOST) for a test distribution system. The reliability worth of network reinforcements (RWNR) is examined to illustrate the importance of using TVRT. II. TIME-VARYING MODELS A. Time-Varying Component Models A two-state model is usually used to represent a component in a basic reliability evaluation of a distribution system [5]. The failure and repair rates are assumed to be constant in this model. The time-varying two-state model shown in Fig. 1 is utilized in this study. In this model, the failure rate and the repair rate are functions of time. In this model, a year is divided into 8760 0885–8977/02$17.00 © 2002 IEEE WANG AND BILLINTON: RELIABILITY COST/WORTH ASSESSMENT OF DISTRIBUTION SYSTEMS 261 discrete hours, and the component failure rates are assumed to be constant for each hour. The restoration times are assumed to be lognormal distributed. Other distributions can be selected to describe the restoration times. B. Time-Varying Failure Rate IEEE Standard 346 [13] subdivides the weather environment into three classifications: 1) normal; 2) adverse; 3) major storm disaster. The failure rate is assumed to be constant for a given weather condition. A TVFR is introduced in this paper to represent the can be time-varying nature of the failure rate. A TVFR obtained using the average failure rate in the normal weather condition weighted by the chronological variation of weather as shown in Fig. 2. The failure rate at hour can be calculated using the following equation: Fig. 1. Time-varying two-state component model. Fig. 2. Chronological variation of weather. (1) is the time-varying weather weight factor, and where the failure rate for the normal weather condition. is C. Time-Varying Restoration Time Both weather conditions and available repair resources affect the system restoration time. The effect of weather conditions can be represented by weather weight factors, which can be obtained from utility past repair experience for different weather conditions. Weather weight factors can be incorporated with the chronological weather variation to form the time-varying . The effect of available restoration reweather factor sources can be represented by a daily TVRT weight factor and an hourly TVRT weight factor based on repair and switching experience. The restoration time for hour can be calculated using (2) in which is the restoration time for the normal weather condition. The hourly TVRT weight factors used in this paper are shown in Fig. 3. The weekly weight factors are shown in Fig. 4. The daily TVRT weight factor is 1.2 during a weekend. Fig. 3. Hourly TVRT weight factor. Fig. 4. Weekly TVRT weight factor. (2) It should be noted that the objective of this paper is to present a general methodology for considering the time-varying nature in reliability cost/worth assessment. The failure rates and restoration times are weighted during winter and summer seasons. The weight factors used in an actual system should be based on weather data and system past restoration experience in different weather conditions. It is not realistic to attempt to create universal time-varying models for each parameter, which are suitable for all utilities. Time-varying models, therefore, should be developed for different systems based on geographic location, weather conditions, and system resources, etc. D. Cost and Load Models Average interruption costs (AIC) for seven customer sectors designated as sector customer damage functions (SCDF) have been developed [14]. These SCDF are shown in Fig. 5. The average and time-varying models for cost and load developed in [8] can be used in the analysis. III. TIME-SEQUENTIAL TECHNIQUE The principles of the basic time sequential simulation are illustrated in [5]. The procedure considering TVFR, TVRT, timevarying cost (TVC), and time-varying load (TVL) is shown in Fig. 6. The most important step is to generate the adjusted time to failure (TTF) at a specific simulation time. The adjusted time to repair (TTR) and the adjusted time to switching (TTS) are then generated at the adjusted TTF. The adjusted TTF can be calculated based on the adjusted failure rate determined using (1). The adjusted TTR and TTS can be determined using (2). The reliability worth impact for load point caused by failure event can be calculated using the following equations: 262 IEEE TRANSACTIONS ON POWER DELIVERY, VOL. 17, NO. 1, JANUARY 2002 Fig. 5. Sector interruption costs ($/kW). The energy not supply are and the interruption cost (3) (4) where failure duration that can include any required adjustments; adjusted average load; adjusted per-unit interruption cost. and the interruption cost The total energy not supply for the total simulation years TST are (5) Fig. 6. Flowchart of the simulation procedure. (6) is the total number of failure events in the specified where simulation period. and the expected The expected energy not supply are interruption cost (7) (8) ) plays The reliability worth of network reinforcement ( an important role in power system planning, design, and exis large or equals the investment in pansion. If the the reinforcement, both utilities and customers will benefit. The can be calculated using the following equation: (9) where and are the system or load point interruption costs before and after reinforcement, respectively. IV. COMPUTER PROGRAM AND SYSTEM ANALYSIS A computer program called TSDISREL99, which uses the time-sequential simulation technique considering the system time-varying nature, has been developed. The load point and system indices and their probability distributions considering TVRT, TVRF, TVL, and TVC can be calculated. The effects of overlapping failures, dispersed nature of cost data, and load uncertainty can also be evaluated using the program. The distribution system shown in Fig. 7 is used to illustrate the technique. The basic reliability parameters for this system are presented in [13]. The element restoration times were assumed to be lognormally distributed for a given weather condition with standard deviations of half their average values. The effects on unreliability cost indices of time-varying parameters and the reliability worth of network reinforcement using TVRT are illustrated in the following sections. WANG AND BILLINTON: RELIABILITY COST/WORTH ASSESSMENT OF DISTRIBUTION SYSTEMS Fig. 8. 263 Load point failure rates for Cases 1 and 2. Fig. 7. Representative urban distribution system. A. Effect of Time-Varying Parameters Three cases are presented to illustrate the effects of timevarying parameters on the unreliability indices. Case 1—Considering Constant Parameters: This is the base case in which constant average loads, costs, failure rates and and indices restoration times are used. The are calculated for comparison purposes. Case 2—Considering Time-Varying Failure Rates: Average loads, costs, and restoration times and time-varying failure rates and of are used in this case. The failure rates the load points are shown in Figs. 8–10. In the case of a radial system, the individual load point failure rates are determined by the average component failure rates. The load point failure rates will therefore be the same as those obtained using average values of the time-varying failure rates. This is not the case in a parallel redundant configuration in which failure bunching due to adverse weather occurs. In order to illustrate the effect of using time-varying failure rates, the average component failure rates in Case 1 were used in (1). This causes the failure rates for all the load points to increase considerably. The and values for all the load points increase when timevarying failure rates are used. The indices for the industrial customers (Load points 8 and 9) have larger percentage increases than those for other customers, as these customers are sensitive to failure frequency. Case 3—Considering Time-Varying Restoration Times: In this case, the loads, costs, and failure rates are assumed to be constant and time-varying restoration times are used in this and indices are shown in Figs. 11 case. The and 12. It can be seen from Figs. 11 and 12 that the load and increase significantly with varying point restoration times The availability of adequate restoration resources during difficult weather conditions is an important consideration for electric power utilities. Measures to reduce Fig. 9. Load point ECOST for Cases 1 and 2. Fig. 10. Load point EENS for Cases 1 and 2. restoration time include more repair resources, including spares, and to replace manual sectionalizing with automatic facilities. System Unreliability Indices for the Three Cases: The and for the three cases are shown system in Table I. It can be seen from the table that using average load and costs results in pessimistic estimates compared to using time-varying load and costs. The values obtained using time-varying failure rates and restoration times are larger than those obtained using constant failure rates and restoration times. B. Effects on RWNR of TVRT The reliability worth of three different network reinforcements for the distribution system in Fig. 7 is illustrated in this section. The distribution system is first modified to a system (Case A) in which there are no disconnect switches in the main sections and no alternative feeder supplies. Disconnect switches are installed in selected locations on the main sections in Case B. 264 Fig. 11. Fig. 12. IEEE TRANSACTIONS ON POWER DELIVERY, VOL. 17, NO. 1, JANUARY 2002 Load point ECOST for the two load models. Fig. 13. Load point RWSA for Case B using the two models. Fig. 14. System RWSA for Case B using the two models. Fig. 15. Load point RWAA for Case C using the two models. Fig. 16. System RWAA for Case C using the two models. Load point EENS for the two load models. SYSTEM EENS TABLE I AND ECOST FOR THE THREE CASES Alternate supplies are then added to all feeders to create Case C. The three cases were evaluated and compared using both constant restoration times (CRT) and TVRT. Reliability Worth of Disconnect Switches: The function of disconnect switches in the main feeder is to isolate failed elements and affected load points and to restore other loads to service if a failure occurs in the main section. In this example, ten disconnect switches were installed in the system used in Case B. The reliability worth of the disconnect switch additions (RWSA) obtained using the two models is shown in Figs. 13 and 14. calculated using the two It can be seen that the for some load models exhibit large differences. The points (7, 9, 15, 21, and 22) is zero as disconnect switches have no effect on the reliability at these load points. The results show that some load points benefit considerably from the installation of disconnect switches, and some do not. Reliability Worth of Alternative Supply: After the failed elements are isolated from the system, service of some load points is restored through the main supply and service to some load points is restored by an alternative supply. Alternative supplies were provided on each feeder in the system of Case C. The re) is liability worth of the alternative supply additions ( shown in Figs. 15 and 16. Comparing the results of Case C with those from Case B, for some load points increase it can be seen that the using TVRT increases significantly. The total system from $31 752 in Case B to $81 167 in Case C. It increases from $7964 for Case B to $20 584 in Case C using CRT. The CRT underestimates the reliability worth of the disconnect switch and alternative supply additions. The results suggest that to replace the manual switch devices with automatic devices and to cut restoration times is a very important measure to reduce customer interruption costs. WANG AND BILLINTON: RELIABILITY COST/WORTH ASSESSMENT OF DISTRIBUTION SYSTEMS V. CONCLUSION The concepts of time-varying failure rates and restoration times are introduced in this paper to incorporate the effects of variable weather conditions and restoration resources into the reliability evaluation of distribution system. A time-sequential simulation technique to consider chronological issues and system random behavior is presented. The results presented show that in general, time-varying failure rates result in a large increase in the unreliability cost indices for frequency sensitive load and a slight increase for the others. Time-varying restoration times have significant impact on the unreliability cost indices. The results calculated using the CRT results in the underestimate of reliability worth of the network reinforcement. The effects on the interruption costs of TVRT and TVFR have to be used in the distribution system design and reinforcements. REFERENCES [1] M. J. Sullivan, T. Vardell, B. N. Suddeth, and A. Vojdani, “Interruption costs, customer satisfaction and expectations for service reliability,”, IEEE Paper 95 SM, 572-8 PWRS. [2] J. G. Dalton III, D. L. Garrison, and C. M. Fallon, “Value-based transmission planning,”, IEEE Paper 95 SM, 566-0 PWRS. [3] E. G. Neudorf et al., “Cost benefit analysis of power system reliability: Two utility case studies,” IEEE Trans. Power Syst., vol. 10, pp. 1667–1675, Aug. 1995. [4] R. E. Brown, S. Gupta, R. D. Christie, S. S. Venkata, and R. Fletcher, “Distribution system reliability assessment using hierarchical Markov modeling,” IEEE Trans. Power Delivery, vol. 11, pp. 1929–1934, Oct. 1996. [5] R. Billinton and P. Wang, “Teaching distribution system reliability evaluation using Monte Carlo simulation,” IEEE Trans. Power Syst., vol. 14, pp. 397–403, May 1999. [6] P. Noferi, L. Paris, and L. Salvaderi, “Monte Carlo methods for power system reliability evaluation in transmission and generation planning,” in Proc. Annu. Reliab. Maintainab. Symp., Washington, DC, 1975, Paper 1294. [7] J. C. O. Mello, M. V. F. Pereira, and A. M. Leite da Silva, “Evaluation of reliability worth in composite systems based on pseudo_sequential Monte Carlo simulation,” IEEE Trans. Power Syst., vol. 9, pp. 1318–1326, Aug. 1994. 265 [8] P. Wang and R. Billinton, “Time sequential distribution system reliability worth analysis considering time-varying load and cost models,” IEEE Trans. Power Delivery, vol. 14, pp. 1046–1051, July 1999. [9] M. V. F. Pereira, M. E. P. Maceira, G. C. Oliveira, and L. M. V. G. Pinto, “Combining analytical models and Monte Carlo techniques in probabilistic power system analysis,” IEEE Trans. Power Syst., vol. 7, pp. 265–272, Feb. 1992. [10] R. Billinton and R. N. Allan, Reliability Evaluation of Power Systems. New York: Plenum, 1984. [11] K. A. Clements, B. P. Lam, D. J. Lawrence, T. A. Mikolinnas, A. D. Reppen, R. J. Ringlee, and B. F. Wollenberg, “Transmission system reliability methods-mathematical models, computing methods and results,” Power Technologie Inc., Schenectady, NY, EPRI EL-2526, July 1982. [12] R. Billinton and W. Li, “A novel method for incorporating weather effects in composite system adequacy evaluation,” IEEE Trans. Power Syst., vol. 6, pp. 1154–1160, 1991. [13] Terms for Reporting and Analyzing Outages of Electrical Transmission and Distribution Facilities and Interruptions to Customer Service, IEEE Stand. 346, 1973. [14] R. N. Allan, R. Billinton, L. Goel, I. Sjarrief, and K. S. So, “A reliability test system for educational purposes-basic distribution system data and results,” IEEE Trans. Power Syst., vol. 6, pp. 813–820, 1991. Peng Wang was born in China. He received the B.Sc. degree from Xian Jiaotong University, Xi’an, China, in 1978, the M.Sc. degree from Taiyuan University of Technology in 1987, and the M.Sc. and Ph.D. degrees from the University of Saskatchewan, Saskatoon, Canada, in 1995 and 1998, respectively. Roy Billinton (F’78) came to Canada from England in 1952. he received the B.Sc. and M.Sc. degrees from the University of Manitoba, Winnipeg, Canada, and Ph.D. and D.Sc. degrees from the University of Saskatchewan, Saskatoon, Canada. He joined the University of Saskatchewan in 1964. Presently, he is Associate Dean of Graduate Studies, Research, and Extension of the College of Engineering, University of Saskatchewan. Dr. Billinton is Fellow of the EIC, the Royal Society of Canada, the Canadian Academy of Engineering, and a Professional Engineer in the Province of Saskatchewan.
