Lecture 21
advertisement
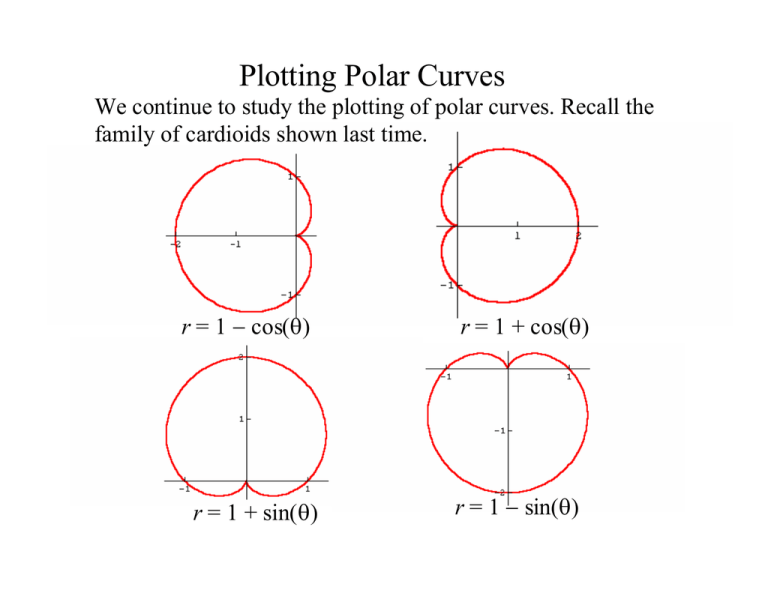
Plotting Polar Curves We continue to study the plotting of polar curves. Recall the family of cardioids shown last time. r = 1 − cos(θ) r = 1 + sin(θ) r = 1 + cos(θ) r = 1 − sin(θ) Now let us look at a similar curve r = 2 + 4cos(θ). When = 0, r = 6. At θ = π/2, cos(θ) = 0, and so r = 2. Therefore, as the angle of the hand moves from 0 to π/2, the point on the curve moves down the hand from 6 to 2. This is shown below. As the angle of the hand moves from π/2 to π, the point on the curve moves down the hand from 2 to −2. Thus there must be an angle where r = 0. To find that, solve 0 = 2 + 4cos(θ ) to get cos(θ ) = −1/2. Thus θ = 2π/3. This much of the move is shown below. 2π/3 Now we continue the motion to π, and at that point r = −2. This final part of the move through the second quadrant is shown below. 2π/3 This process is played out in reverse as we go through the third quadrant. The length of r begins at −2 and ends at 2. This motion is shown below. Finally, in the fourth quadrant, as θ moves from 3π/2 to 2 π, the cosine goes from 0 to 1, and r increases from 2 to 6 as shown finally below. One of the most important considerations in graphing is symmetry. By analyzing symmetry, we can often reduce the amount of graphing significantly. Theorem. (symmetry tests) (a) A curve in polar coordinates is symmetric about the x-axis if replacing θ by −θ in its equation produces an equivalent equation. (b) A curve in polar coordinates is symmetric about the y-axis if replacing θ by π−θ in its equation produces an equivalent equation. This is also true if replacing θ by −θ and r by −r produces an equivalent equation. (c) A curve in polar coordinates is symmetric about the origin if replacing r by −r in its equation produces an equivalent equation. π/2 π/2 (r, θ) (r, θ) (r, π−θ) 0 0 (r, −θ) Symmetry about the x-axis Symmetry about the y-axis π/2 (−r, −θ) π/2 (r, θ) (r, θ) 0 (r, −θ) Symmetry about the y-axis 0 (−r, θ) Symmetry about the origin. The curve r = 2 + 4cos(θ) is symmetric about the x-axis, since the equation is unchanged by replacing θ by −θ . Thus when we had plotted this much of the curve: we could have immediately added on the reflection in the x-axis, getting This figure is called a limacon with inner loop. Similar ones are shown below. 2 − 4*cos(θ ) 2 + 4*sin(θ ) 2-4*sin(θ ) 2 − 4*cos(θ ) Note that this one has symmetry about the x-axis also. 2 + 4*sin(θ) This one has symmetry about the y-axis, since the equation remains the same when we replace θ by π−θ. 2 − 4*sin(θ) This one has symmetry about the y-axis, since the equation remains the same when we replace θ by π−θ. If we now let us look at the curve r = 4 + 3cos(θ), with the larger number as the constant, the graph is similar to the cardioid, except that r never reaches 0. This curve plots as follows: This type of curve is called a dimpled limacon. If the constant is made even larger in relation to the coefficient of cosine, the dimple disappears. The first time the dimple disappears in the function r = a + bcos(θ) is when a/b = 2. Below is shown the convex limacons (dimple gone) r = 6 + 3cos(θ) and r = 6 + 2cos(θ) r = 6 + 3cos(θ) r = 6 + 2cos(θ) Problem. Plot the graph of the function r = sin(2θ) in polar coordinates The difficulty here is that 2θ moves around the circle at twice the speed of θ, and 2θ is the angle that determines how the basic trigonometric functions change. Thus, instead of letting θ go through a basic change of π/2, we must see what happens when (2θ) goes through such a change, or when θ increases by an amount π/4. When θ = 0, r = sin(2θ) = 0. At θ = π/4, r = sin(π/2) = 1. Therefore, as the angle of the hand moves from 0 to π/4, the point on the curve moves up the hand from 0 to 1. This is shown below. π/4 Fromθ = π/4 to θ = π/2, 2θ moves from π/2 to π, and so r moves from 1 to 0. This is shown below. Fromθ = π/2 to θ = 3π/4, 2θ moves from π to 3π/2, therefore the sine changes from 0 to −1. This means that r moves from 0 to −1. Finally, as we increase from θ = 3π/4 to θ = π, 2θ moves from 3π/2 to 2π, therefore the sine changes from −1 to 0. This means that r moves from −1 to 0, and we have At this point θ is π and the ray (clock hand) is pointing to the left. We now note that the equation is symmetric with respect to the y axis, since sin(2(π−θ)) = sin(2π−2θ)) = sin(2π)cos(−2θ) − cos(2π)sin(−2θ) = sin(2θ). Thus we can include in the graph, the reflection about the y-axis, which leads to the graph. This second half would be plotted in the third and fourth quadrant, and then the process would repeat indefinitely. This curve is called a 4-leaf rose. The following shows a similar curve. r = sin(3θ) To plot this curve, 3 needs to move π/2 units at a time, which means that θ needs to be increased by π/6 or 30 degrees at a time. Here is another related example. r = sin(4θ) To plot this curve, θ needs to be increased by π/8 radians at a time at a time (22.5 degrees). Here are some more roses. r = sin(5θ) r = sin(7θ) r = sin(6θ) r = sin(8θ) r = cos(2θ) r = cos(4θ) r = cos(3θ) r = cos(5θ) Clearly the curves r = sin(nθ) and r = cos (nθ ) are roses with n leaves when n is odd and with 2n leaves when n is even. Draw in polar coordinates the curve r = θ. Here r increases steadily as the angle increases. The result is shown below, and is called an Archimedean spiral. Two similar curves are shown below. The first is called a logarithmic spiral and has general form r = aebθ, and the second is called a hyperbolic spiral and has general form r = a/θ. r = exp(.1θ) r = 1/θ Identify the curve r = 4cosθ. + 4 sinθ. by transforming to rectangular coordinates. Multiplying by r, we obtain r2 = 4rcosθ. + 4rsinθ. In 2 + y 2 = 4x + 4 y x rectangular coordinates, this is If we now complete the square, we get x2 − 4 x + 4 + y2 − 4 y + 4 = 8 or (x − 2)2 + ( y − 2)2 = 8 This is a circle with center (2, 2) and radius 2√2. The circle also goes through the point (0, 0). It is shown below. Identify the curve r = 6/(3cosθ. + 2sinθ). by transforming to rectangular coordinates. Multiplying by the denominator, we obtain 3r cosθ + 2r sinθ = 6 or 3x + 2y = 6. This is the straight line shown below. Many polar curves have extremely exotic form. As an example, we look at 5θ r = 2+ cos 2 To get all of this curve, we must go from 0 to 4π.
