Application
Note: 52051
Rapid Evaluation of Smelting Copper Compounds
Using Automated Multivariate Statistical Phase
Analysis of EDS Spectral Imaging Data
Dr. Mitsuhiro Wada, Corporate R&D Center, Mitsui Mining & Smelting Co., Ltd., Japan
Introduction
Key Words
• COMPASS
Software
• Mining
• Ore Analysis
• Peak
Deconvolution
• Quantitative
Mapping
• Smelting
In non-ferrous metal smelting operations, each element is
refined from very complex compound material in which
the major elements are Cu, Zn and Pb. When smelting Cu,
it is very important to understand the complex morphology
of the various compounds in the raw material. This detailed
understanding of the complex morphology is necessary to
improve the refining efficiency of each element. Currently,
inductively-coupled plasma (ICP), X-ray diffraction (XRD)
and electron probe microanalysis (EPMA) are used for the
evaluation of the raw materials. However, ICP and XRD can
only provide information about average, bulk composition.
EPMA may take several hours to do a quantitative
analysis of a complex sample containing 10 to 20 elements
and many phases. EPMA also requires highly experienced
analysts to operate the instrument and evaluate a mixed
compound material by using electron image contrast.
Recent developments in Silicon Drift Detectors (SDD)
have improved the detection efficiency of energy-dispersive
spectroscopy (EDS) and significantly reduced acquisition
times. Robust peak deconvolution methods have improved
the quality of EDS spectral imaging data to near that of
EPMA. Furthermore, the introduction of EDS multivariate
analytical methods simplify the analysis of phase distributions as opposed to just elemental distributions.
In this study we analyzed Cu-compound raw material by
phase analysis using the multivariate statistical analysis of
EDS spectral imaging data (Thermo Scientific COMPASS
software). Even though the acquisition time was very short
(30 minutes) relative to EPMA or ICP, we could determine
the complicated distribution of the various phases.
Acquisition Conditions
EDS Analyzer:
EDS Detector:
Accelerating Voltage:
Magnification:
Mapping Resolution:
Acquisition Time:
Stores Rate:
Dead Time:
NORAN System 7
UltraDry 30 mm2
12 kV
400×
256 × 192
30 minutes
19,600 cps
22%
Results and Study
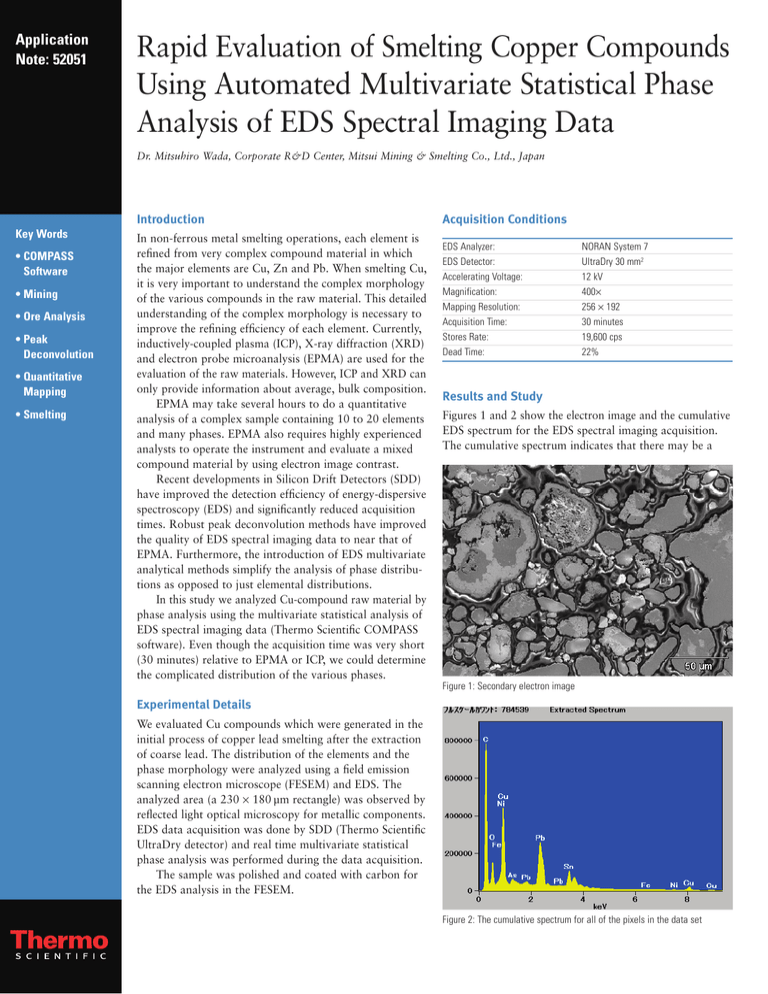
Figures 1 and 2 show the electron image and the cumulative
EDS spectrum for the EDS spectral imaging acquisition.
The cumulative spectrum indicates that there may be a
Figure 1: Secondary electron image
Experimental Details
We evaluated Cu compounds which were generated in the
initial process of copper lead smelting after the extraction
of coarse lead. The distribution of the elements and the
phase morphology were analyzed using a field emission
scanning electron microscope (FESEM) and EDS. The
analyzed area (a 230 × 180 µm rectangle) was observed by
reflected light optical microscopy for metallic components.
EDS data acquisition was done by SDD (Thermo Scientific
UltraDry detector) and real time multivariate statistical
phase analysis was performed during the data acquisition.
The sample was polished and coated with carbon for
the EDS analysis in the FESEM.
Figure 2: The cumulative spectrum for all of the pixels in the data set
Na-K
Zn-L
S-K
Pb-M
Al-K
Se-L
Sn-L
Ca-K
In-L
Sb-L
variety of potential peak overlaps of different elemental
peaks. Figure 3 provides illustrations of a few of these
overlap conditions.
Figure 4 shows the elemental distributions using
conventional peak count maps. Any peak overlaps
identified by Figure 3 are not corrected in these maps.
These overlaps may provide false element intensities that
will affect the interpretation of the spatial distribution of
the elements.
Figure 5 shows the results of the peak deconvoluted
quantitative elemental maps. It displays the real distributions
of S, Sb, Ca, Al which were not shown properly in the
conventional peak count maps because of overlapping
peaks of other elements.
Figure 3: Peaks of characteristic X-rays of analyzed elements
Figure 5: Quantitative spectral images
Figure 4: Conventional peak count maps
Figure 6 show the principal component maps extracted
by COMPASS multivariate imaging analysis software,
which processes and displays during the data acquisition.
The evaluation of these results plays a key part in
identifying and improving the processing steps to improve
the efficiency of refining Cu compounds. Although the
data acquisition time was only 30 minutes, the analytical
data is complete. These rapid results ensure an improved
throughput to the refining process.
Furthermore by evaluating materials produced in each
refining process with this analysis method, the verification
work of the material becomes very easy and simple.
Spectral Details of Overlapping Peaks
C-1: Copper tin alloy (Cu + CuSn3)
C-2: Resin
C-3: Lead Sulfied including Cu, Se(PbS)
C-4: Cu sulfide (Cu2S or Cu7S4)
C-5: CuSn oxide including As, Pb
C-6: Arsenic copper including Sb (γ : AsCu3)
C-7: Ni alloy (Ni, Pb)-Sn-(As, Sb)
C-8: CuSnZn oxide including As, Pb
Figure 6: The first through eighth component maps of the 16 components
extracted by COMPASS multivariate analysis software clearly show the
morphologies of the Cu compounds which are difficult to understand
thorough element maps alone.
The spectra of the first through the eighth principal
components and the standardless quantitative results of
the spectral data where the intensities of each component
are especially strong are shown in Figure 7.
From these results, it became clear that the Cu
compounds evaluated in this study have the following
morphology of the elements and the distributions.
1. The main phase is a Cu-Sn alloy phase.
2. A Cu-Sn alloy phase exists as an associated phase with
the Pb metal phase.
3. A combination phase consisting of oxides of Cu-Sn-Pb
and Cu-sulfide exist as a nucleus which is encased by
Pb-sulfide.
4. The glass component phase (C-9) and calcium fluoride
phase (C-16) were easily distinguished. These components
are very difficult to detect by EPMA if their presence
was not expected.
5. S in Pb was identified which is very difficult to evaluate
by conventional EDS element mapping. The typical
distributions of small amounts of As, Se, In, Sb included
in Cu-Sn alloy were clearly identified.
EDS has the following advantages over EPMA in that it can
acquire the X-rays of the whole energy range simultaneously
and collect X-ray maps at very low magnifications (less
than 1000×) without requiring microscope stage scanning.
However, this sample exhibits numerous combinations
of elements where the characteristic EDS X-ray peaks
overlap. Therefore, up to this point EPMA had been
used to analyze these samples.
The conventional peak counts map (Figure 4) method
simply extracts the X-ray counts in a given energy range
of the peaks. Therefore, it may include X-ray counts of
other element peaks which overlap. For example, the Al-K
map has information from the Se-L peak, while the Ca-K,
In-L, and Sb-L maps have information from the Sn-L
peak. The S-K map is very similar to the Pb-M map.
The deconvolution method for maps (Figure 5) is
exactly the same as that routine for individual spectra
except that it is applied to a kernel of pixel spectra for
enhanced statistics. The corrective steps are as follows:
1. Remove the background (brehmstrahlung) of the
EDS spectrum.
2. Separate the contributions of each element from
overlapped peaks and provide net count maps.
3. Apply the appropriate matrix corrections to display
atomic or weight percent data.
The spectral image results are very similar to those
collected from the EPMA which uses wavelength-dispersive
spectroscopy with higher spectral resolution. However,
it is very difficult to understand the morphology of the
chemical compounds from elemental maps.
C-1: CuSn Alloy
(Cu+CuSn3 )
Element Line
Cu L
Sn L
Weight %
76.11
23.89
Atom %
85.61
14.39
C-4: Cu sulfied
(Cu2S or Cu7S4)
Element Line
SK
Cu K
Weight %
24.09
75.91
C-6: Arsenic Cu
Including Sb ( γ : AsCu3 )
Element Line
Cu L
As L
Sb L
Weight %
70.07
26.32
3.61
Atom %
74.32
23.68
2.00
Atom %
38.62
61.38
C-5: CuSn oxide
Including As, Pb
Element Line
CK
OK
Cu K
As L
Sn L
Pb M
Weight %
5.09
21.61
8.96
2.84
56.59
4.90
Atom %
17.27
55.04
5.75
1.55
19.43
0.96
C-3: Lead sulfied
Including Cu, Se (PbS)
C-8: CuSnZn oxide
Including As, Pb
Element Line
SK
Cu L
Se L
Pb M
Weight %
11.74
2.38
5.21
80.67
Atom %
42.64
4.36
7.68
45.32
C-7: Ni Alloy (Ni, Pb)
-Sn- (As, Sb)
Element Line
CK
OK
SK
Cu L
Zn L
Sn L
Sb L
Pb M
Total
Weight %
4.50
26.01
1.11
11.45
6.78
28.61
10.06
11.48
100.00
Atom %
13.89
60.25
1.28
6.68
3.85
8.94
3.06
2.05
100.00
The second principal component was omitted because
it is mounting epoxy.
Element Line
CK
Ni L
As L
Sn L
Sb L
Pb M
Weight %
2.28
29.87
3.58
18.07
39.72
6.47
Atom %
15.13
40.50
3.81
12.12
25.96
2.49
Figure 7: Principal Component spectra by COMPASS and the standardless
quantitative results of the raw data of the area where each component
intensity is typically strong.
In addition to these
offices, Thermo Fisher
Scientific maintains
a network of representative organizations
throughout the world.
C-9: Vitreous
SiOxFNaCaPb
C-4: Cu sulfide
(Cu2S or Cu7S4)
C-13: PbSn sulfied
C-8: CuSnZn oxide
including PbSbS
C-5: CuSn oxide
including AsPb
C-16:
Ca-F(CaF2)
C-3: Pb sulfide
including
Cu,Se PbS)
C-2: Resin
C-1:
CuSnAlloy
(Cu+Cu3Sn)
C-14: Cu compound
oxide including
Pb,In,S,Sn,Sb
C-15:
CuSn oxide
including
Pb,Sb
C-10: Fe oxide
including PbSnZn
C-11: PbZn sulfide
C-12: Pb metal
C,O soluted
C-7: Ni alloy
(Ni,Pb)-Sn-(As,Sb)
C-6: Arsenic Cu
including Sb
(γ : AsCu3)
Figure 8: Sixteen phases automatically extracted by COMPASS software
Conclusion
Reference
By using multivariate statistical analysis software
(COMPASS), we could easily and rapidly determine the
morphology, distribution and chemistry of each distinct
compound generated in the initial process of copper lead
smelting. This lead to adjustment of the refining process
and a cost savings to the smelting process.
M. Wada, Journal of Advanced Science, 22(2010)1-6.
www.thermoscientific.com
©2011 Thermo Fisher Scientific Inc. All rights reserved. All trademarks are the property of Thermo Fisher Scientific Inc. and its subsidiaries.
Specifications, terms and pricing are subject to change. Not all products are available in all countries. Please consult your local sales representative for details.
Part of Thermo Fisher Scientific
Africa-Other
+27 11 570 1840
Australia
+61 3 9757 4300
Austria
+43 1 333 50 34 0
Belgium
+32 53 73 42 41
Canada
+1 800 530 8447
China
+86 10 8419 3588
Denmark
+45 70 23 62 60
Europe-Other
+43 1 333 50 34 0
Finland / Norway /
Sweden
+46 8 556 468 00
France
+33 1 60 92 48 00
Germany
+49 6103 408 1014
India
+91 22 6742 9434
Italy
+39 02 950 591
Japan
+81 45 453 9100
Latin America
+1 561 688 8700
Middle East
+43 1 333 50 34 0
Netherlands
+31 76 579 55 55
New Zealand
+64 9 980 6700
Russia/CIS
+43 1 333 50 34 0
South Africa
+27 11 570 1840
Spain
+34 914 845 965
Switzerland
+41 61 716 77 00
UK
+44 1442 233555
USA
+1 800 532 4752
Thermo Electron Scientific
Instruments LLC, Madison, WI
USA is ISO Certified.
AN52051_E 02/11M


