Introduction to TDS 1012 Digital Oscilloscope
advertisement

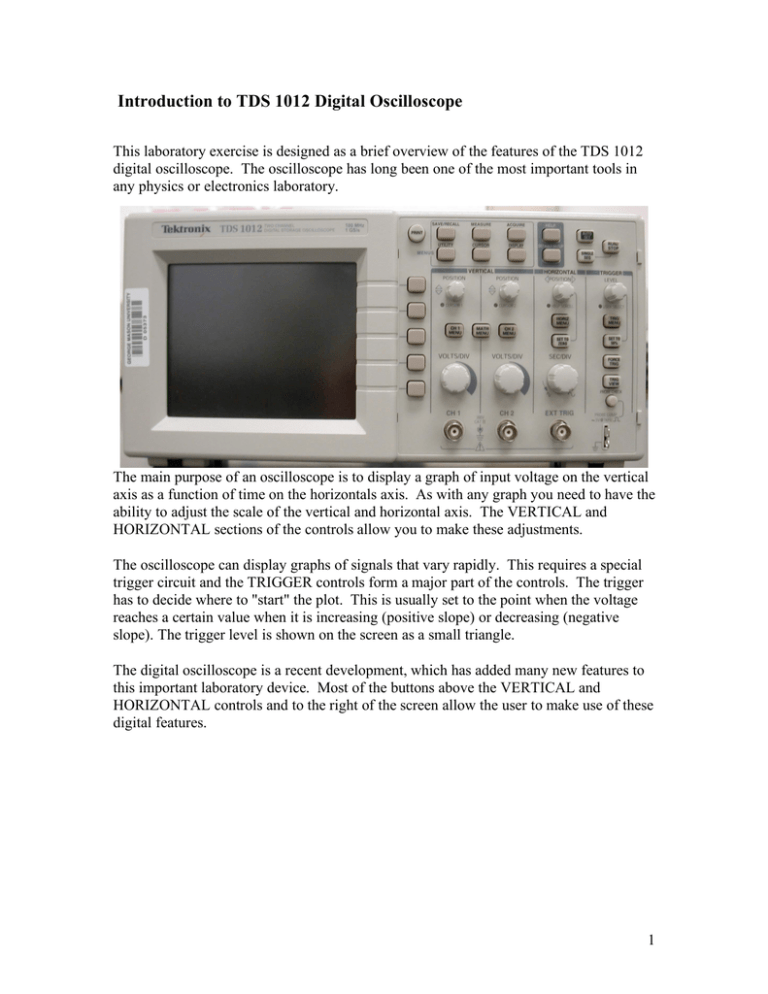
Introduction to TDS 1012 Digital Oscilloscope This laboratory exercise is designed as a brief overview of the features of the TDS 1012 digital oscilloscope. The oscilloscope has long been one of the most important tools in any physics or electronics laboratory. The main purpose of an oscilloscope is to display a graph of input voltage on the vertical axis as a function of time on the horizontals axis. As with any graph you need to have the ability to adjust the scale of the vertical and horizontal axis. The VERTICAL and HORIZONTAL sections of the controls allow you to make these adjustments. The oscilloscope can display graphs of signals that vary rapidly. This requires a special trigger circuit and the TRIGGER controls form a major part of the controls. The trigger has to decide where to "start" the plot. This is usually set to the point when the voltage reaches a certain value when it is increasing (positive slope) or decreasing (negative slope). The trigger level is shown on the screen as a small triangle. The digital oscilloscope is a recent development, which has added many new features to this important laboratory device. Most of the buttons above the VERTICAL and HORIZONTAL controls and to the right of the screen allow the user to make use of these digital features. 1 Introduction: TDS 1012 Digital Oscilloscope Read through each section, perform the suggested operations and answer the questions. You can’t break anything so feel free to explore the controls. The instructions are sketchy, so if you can’t figure something out, ask your instructor. Procedure: 1. Connect the MAIN OUT of the Wavetek Function Generator to channel 1 (CH 1) of the oscilloscope and connect the AUX OUT to channel 2 (CH 2). Set the Wavetek to frequency = 1.0 kHz, Vpp = 4.0 volts, function = sine wave, amplitude modulation = OFF and DC OFFSET = 0. 2. Turn on the oscilloscope and press the AUTOSET button. This makes the necessary adjustments to the oscilloscope so you should be able to see the waveforms of a sine wave in channel 1 and a square wave in channel 2. These waveforms are a plot of voltage vs. time with scale information at the bottom of the screen. The scale information is given in units of volts or seconds per division where division refers to the lines on the screen that are about a cm apart. 3. Please note that the AUTOSET button is very useful to get you started, but it changes a number of settings, so it should not be used all of the time. 4. Experiment to determine the effect of the POSITION and VOLTS/DIV knobs for both channel 1 and channel 2. Note that the volts per division for each channel appear at the bottom left of the screen. 5. Press the CH1 MENU button several times and note that the CH1 waveform is toggled on and off. Pressing the CH1 MENU also gives you some input options on the right side of the screen, which can be activated by pressing the buttons beside them. Try each of these options. Assignment 1. – Draw a sketch of the oscilloscope screen with the two signals described above. Sketch in the grid lines. Record the volt/div for each signal and time/div at the bottom of the screen. Measure the number of vertical and horizontal divisions (including fractional parts) and determine the amplitude and period for each of the signals. Show the calculations. Coupling – DC coupling passes both AC and DC components of the signal; AC blocks the DC component and GND (ground) disconnects the input signal. Under "TRIGGER" press the menu button and change the Coupling to AC. Assignment 2 – Adjust the DC OFFSET on the Wavetek to 1.0 volt and look at channel 1 with AC and DC coupling. Describe what happens and why. Return the DC OFFSET on the function generator to 0. BW Limit – limits the bandwidth to reduce display noise. Volts/DIV – selects the resolution (Coarse or Fine) of the VOLTS/DIV knob. Note the effect of turning the knob when this is set for Coarse and Fine (notice the volts/DIV in the lower left corners of the screen). 2 Probe – A probe is a special connector that reduces a high voltage to a value that the oscilloscope can handle. The Probe option allows you to tell the oscilloscope that a special probe is attached. The Probe should be set for 1x in this laboratory since we will not use special probes. The channel 2 menu works the same as for channel 1. Trigger Control - The function of the trigger control is to set the initial point in time for the waveform to be displayed. Usually this is a certain rising or falling voltage level on channel 1 or channel 2. If the trigger is not set properly then the display will be unstable. Experiment with adjustments to the trigger level and notice how the display can move and become unstable. Press the TRIGGER MENU button and experiment with the different menu options. Assignment 3 – Describe what happens when the TRIGGER slope is switched from “rising” to “falling” and explain why. Horizontal Controls This section controls the horizontal axis, which is time. Notice the effect of turning the POSITION knob and the SEC/DIV knob. It is important to see that the SEC/DIV scale information appears at the bottom-center of the screen. The HORIZONTAL MENU allows you to adjust the window zone (leave it on main) and also selects whether the Trigger Level knob adjusts the trigger level (volts) or hold off time (seconds). The hold off time delays the triggering of the waveform for a fixed amount of time. It is generally better to leave this option in the “level” mode. Special Menus ACQUIRE – The acquire menu gives various options for smoothing the data. Keep in mind that the Wavetek continuously produces sine and square signals. These signals are converted to a digital value and up to 2500 values are stored and displayed. In the sample mode, the oscilloscope records one sweep, displays it and then records another. In the Peak Detect mode it overlaps successive sweeps. In the Average mode it averages a number of sweeps and displays the average. This is usually slower. It gives a cleaner waveform, but you can be tricked into thinking the waveform is very stable when it is not. CURSOR – The cursor menu allows you to make measurements of time or voltage from the waveforms using two cursors, which are controlled by the ch1 and ch2 vertical 3 position knobs. Push the CURSOR button, set Type to Voltage and Source to CH 1. Two horizontal cursors appear. Use the cursor controls (CH 1 and CH 2 POSITION knobs) to place the cursors on the top and bottom of the sine wave. Note that the voltage levels of cursor 1, cursor 2 and the difference between them (Delta) appear to the right of the screen. Assignment 4 – Use the voltage cursors to determine the Vpp of the sine wave and compare this result with the Vpp that the Wavetek display indicates. Assignment 5 – Use the time cursors to determine the period of the sine wave. From this value, calculate the frequency of the sine wave and compare with the frequency that the Wavetek display indicates. Show your calculations. MEASURE – The measure menu instructs the oscilloscope to make various direct measurements of the signals. When you select “SOURCE”, you can choose between ch1 and ch2. When you select “TYPE”, you can select the type of measurement (Vpp, Period, Frequency, etc…) Assignment 6 – Use the MEASURE menu to measure the period, frequency, and Vpp for the sine wave. Compare your results with the answers of Assignment 4 and 5. DISPLAY – skip SAVE/RECALL – This menu allows you to save or recall instrument waveforms or instrument setups (which we will skip). The saved waveforms are referred to as Reference waveform A or B. To save the waveform of channel 1 as Reference waveform A: select Waveforms, Source = CH1, REF = A, and press Save. To display a reference waveform, use the lowest button to turn Ref A on. Assignment 7 Save the waveform of the sine wave in Ref A. Then change the frequency range on the Wavetek to 200 HZ, which reduces the frequency of the sine wave by a factor of four. Display the saved waveform (Ref A). Draw a sketch of the active waveform and the stored waveform. Return the frequency range of the Wavetek to 1 kHz. UTILITY – skip HARDCOPY – skip. This button can be used to print display if a suitable printer is attached. RUN/STOP – Can be used to start or stop the waveform acquisition. 4 Reading Data into the Computer The digital scope at each workstation is connected to the workstation computer. The program Open Choice Desktop controls the reading in of the waveform data from the oscilloscope. Follow the steps below to read in the waveform from the Power response procedure. Make a plot of the data (voltage vs. time) in Excel. Print out the graph to turn in with your experimental data. 1. Click on the icon to open the program. 2. Select (click on) Waveform Data Capture 3. Select Instrument: a. Select ASCRL1::INSTR b. Click ok 4. Select channels if needed 5. Click on Get Data 6. Click on Copy to Clipboard 7. Paste into spreadsheet 8. Make a plot of the data: voltage vs. time 9. Label graph properly and print out the plot only 5 Measuring Unknown Signals Name:____________________ Teachscope Model #____________ The Teachscope is a device that generates twelve unknown voltage signals. Try to locate each of the patterns listed below. Start with the easy ones and then look for the more difficult ones. Record in each table the channel you found the signal and then report on the measurements requested for each signal. Be sure to include units. Please note that every Teachscope box is different so it is important to record the model number of the box you use. square wave channel number maximum voltage minimum voltage frequency (Hz) sine wave (no offset, 5.4 volts peak-peak) channel number maximum voltage minimum voltage frequency (Hz) sine wave (one half-cycle clipped, no offset) channel number maximum voltage minimum voltage frequency (Hz) cycle clipped (positive or negative) 6 +5 VDC channel number ground (with low level noise spikes) channel number sawtooth (long repetition time, positive offset) channel number maximum voltage minimum voltage repetition time (secs) Triangle wave (positive offset) channel number maximum voltage minimum voltage frequency (Hz) TTL pulse (short duration, long repetition time, ground to positive) channel number amplitude (peak volts) repetition time pulse width (nanoseconds) 7 TTL pulse (short duration, long repetition time, negative transition) differentiated square wave (no offset) channel number amplitude (peak volts) repetition time pulse width (nanoseconds) differentiated square wave (no offset) channel number maximum voltage minimum voltage frequency (Hz) sine wave channel number maximum voltage minimum voltage frequency (Hz) TTL pulse (short duty cycle) channel number maximum voltage minimum voltage frequency (Hz) 8


