Measuring Time Delays of Gravitationally Lensed Quasars to
advertisement
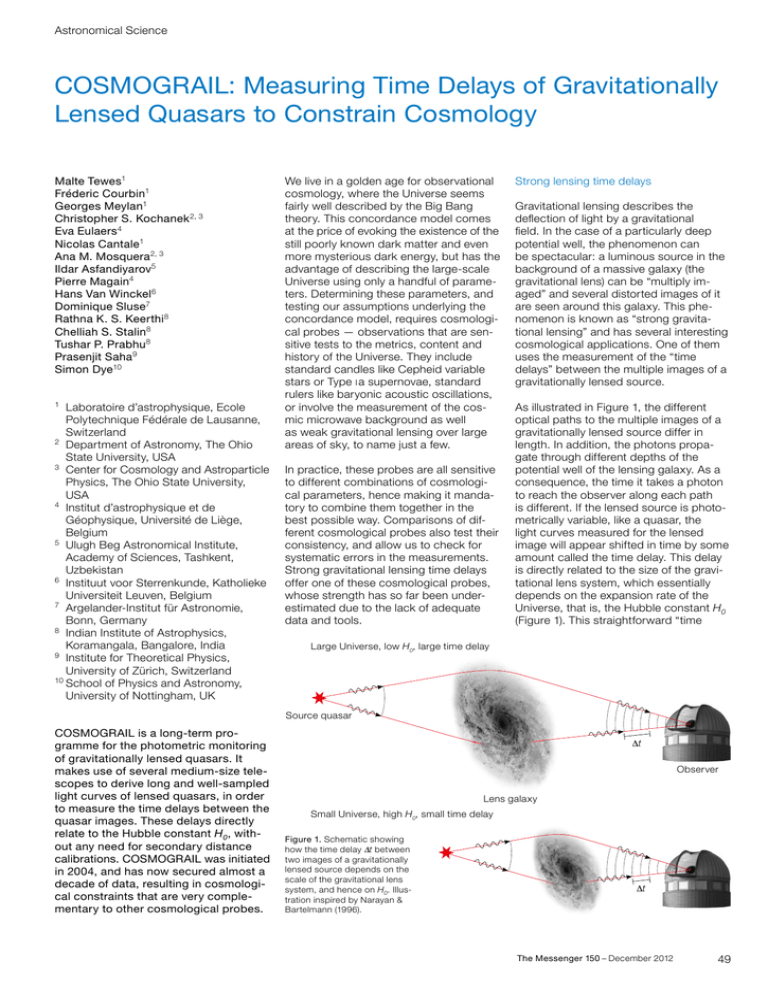
Astronomical Science COSMOGRAIL: Measuring Time Delays of Gravitationally Lensed Quasars to Constrain Cosmology Malte Tewes1 Fréderic Courbin1 Georges Meylan1 Christopher S. Kochanek 2, 3 Eva Eulaers 4 Nicolas Cantale1 Ana M. Mosquera 2, 3 Ildar Asfandiyarov5 Pierre Magain4 Hans Van Winckel 6 Dominique Sluse7 Rathna K. S. Keerthi 8 Chelliah S. Stalin 8 Tushar P. Prabhu 8 Prasenjit Saha 9 Simon Dye10 1 Laboratoire d’astrophysique, Ecole ­Polytechnique Fédérale de Lausanne, Switzerland 2 Department of Astronomy, The Ohio State University, USA 3 Center for Cosmology and Astroparticle Physics, The Ohio State University, USA 4 Institut d’astrophysique et de ­Géophysique, Université de Liège, ­Belgium 5 Ulugh Beg Astronomical Institute, Academy of Sciences, Tashkent, Uzbekistan 6 Instituut voor Sterrenkunde, Katholieke Universiteit Leuven, Belgium 7 Argelander-Institut für Astronomie, Bonn, Germany 8 Indian Institute of Astrophysics, ­Koramangala, Bangalore, India 9 Institute for Theoretical Physics, ­University of Zürich, Switzerland 10 School of Physics and Astronomy, ­University of Nottingham, UK We live in a golden age for observational cosmology, where the Universe seems fairly well described by the Big Bang theory. This concordance model comes at the price of evoking the existence of the still poorly known dark matter and even more mysterious dark energy, but has the advantage of describing the large-scale Universe using only a handful of parameters. Determining these parameters, and testing our assumptions underlying the concordance model, requires cosmological probes — observations that are sensitive tests to the metrics, content and history of the Universe. They include standard candles like Cepheid variable stars or Type i a supernovae, standard rulers like baryonic acoustic oscillations, or involve the measurement of the cosmic microwave background as well as weak gravitational lensing over large areas of sky, to name just a few. In practice, these probes are all sensitive to different combinations of cosmological parameters, hence making it mandatory to combine them together in the best possible way. Comparisons of dif­ ferent cosmological probes also test their consistency, and allow us to check for systematic errors in the measurements. Strong gravitational lensing time delays offer one of these cosmological probes, whose strength has so far been under­ estimated due to the lack of adequate data and tools. Strong lensing time delays Gravitational lensing describes the deflection of light by a gravitational field. In the case of a particularly deep potential well, the phenomenon can be spectacular: a luminous source in the background of a massive galaxy (the gravitational lens) can be “multiply im­­ aged” and several distorted images of it are seen around this galaxy. This phenomenon is known as “strong gravitational lensing” and has several interesting cosmological applications. One of them uses the measurement of the “time delays” between the multiple images of a gravitationally lensed source. As illustrated in Figure 1, the different optical paths to the multiple images of a gravitationally lensed source differ in length. In addition, the photons propagate through different depths of the potential well of the lensing galaxy. As a consequence, the time it takes a photon to reach the observer along each path is different. If the lensed source is photometrically variable, like a quasar, the light curves measured for the lensed image will appear shifted in time by some amount called the time delay. This delay is directly related to the size of the gravitational lens system, which essentially depends on the expansion rate of the Universe, that is, the Hubble constant H0 (Figure 1). This straightforward “time +@QFD4MHUDQRDKNV'K@QFDSHLDCDK@X 2NTQBDPT@R@Q COSMOGRAIL is a long-term pro­ gramme for the photometric monitoring of gravitationally lensed quasars. It makes use of several medium-size tele­ scopes to derive long and well-sampled light curves of lensed quasars, in order to measure the time delays between the quasar images. These delays directly relate to the Hubble constant H0, with­ out any need for secondary distance calibrations. COSMOGRAIL was initiated in 2004, and has now secured almost a decade of data, resulting in cosmologi­ cal constraints that are very comple­ mentary to other cosmological probes. 6S .ARDQUDQ +DMRF@K@WX 2L@KK4MHUDQRDGHFG'RL@KKSHLDCDK@X Figure 1. Schematic showing how the time delay Δt between two images of a gravitationally lensed source depends on the scale of the gravitational lens system, and hence on H0. Illustration inspired by Narayan & Bartelmann (1996). 6S The Messenger 150 – December 2012 49 Astronomical Science Tewes M. et al., COSMOGRAIL delay method” to constrain H0 had already been proposed by Sjur Refsdal in 1964 (Refsdal 1964), well before the first strongly lensed quasar was even discovered by Walsh, Carswell and Weymann in 1979 (Walsh et al., 1979). The COSMOGRAIL monitoring programme Obtaining accurate measurements of time delays is challenging, but has re­cently proved possible. The COSMOGRAIL programme (COSmological MOnitoring of GRAvItational Lenses) is a long-term photo­metric monitoring programme designed to reach this goal. Initiated and led by the Laboratory of Astrophysics of the École Polytechnique Fédérale de Lausanne, it combines the strengths of medium-size telescopes available for long periods of time, with the collecting power and spatial resolution of the ESO Very Large ­Telescope (VLT) and the Hubble Space Telescope (HST). The mediumsize telescopes are needed continuously over several years in order to measure the time delays, while the VLT and HST are needed punctually to obtain deep and sharp observations in order to constrain the lens models. Indeed, the measured time delays can only be turned into cosmological inference given accurate lens mass models. COSMOGRAIL uses several medium-size telescopes to carry out a long-term optical photometric monitoring of selected lensed quasars. Our set of monitoring telescopes includes the Swiss 1.2-metre Leonhard Euler Telescope at the ESO La Silla Observatory (shown in Figure 2), the 2-metre Himalayan Chandra Telescope (HCT) in India, the 1.5-metre telescope of the Maidanak Observatory (Uzbekistan), and, with a smaller contribution, the 1.2-metre Mercator telescope on La Palma (Canary Islands, Spain). In 2010, COSMOGRAIL joined forces with the group of Christopher S. Kochanek (Ohio State University, USA) who employs the 1.3-metre Small & Moderate Aperture Research Telescope System (SMARTS) at the Cerro Tololo Inter-American Observatory in Chile. The resulting collaboration is now the largest quasar lens monitoring programme worldwide. 50 The Messenger 150 – December 2012 Figure 2. The Swiss 1.2-metre Leonhard Euler Telescope at the La Silla Observatory, used for several long-term observational programmes, from exoplanets to cosmology. Euler is the main telescope of the COSMOGRAIL collaboration. Photometry of the deconvolved images allows the use of data spanning a broad range of quality, from 0.8 to 2.0 arcseconds for point source full width at half maximum (Tewes et al., 2012b). Light curves and time delay measurement The light curves for the four lensed images of RX J1131−1231 are presented in Figure 4, where a time delay of image D of about 100 days is striking. With a closer look, however, the curves do not perfectly overlap, even when shifted by the appropriate delays. Some of the mismatches are conspicuous, on time scales of a few weeks to several years. These discrepancies result from quasar micro- With these telescopes, we have gathered almost a decade of photometric data with a temporal sampling of between two and five days depending on the targets. As the lensed images of a typical quasar have angular separations on the order of an arcsecond, our reduction pipeline involves an image deconvolution algor­ ithm that can carry out photon-noise ­limited photometry of heavily blended point sources (e.g., Magain et al., 1998). ­Figure 3 shows an example of such a deconvolution, in the case of the quadruply lensed quasar RX J1131−1231. The quasar is at a redshift of z = 0.658 whilst the lensing galaxy is at z = 0.295. 2 ! # & - " Figure 3. The quadruply lensed quasar RX J1131−1231, seen from space with HST in a colour composite (left; from Claeskens et al., 2006) and from the ground in the R-band with the Swiss 1.2metre Leonhard Euler telescope at La Silla (middle). The right panel shows the deconvolution of the Euler data, as used for our photometry. $ 'TAAKD2O@BD3DKDRBNOD 2VHRR+DNMG@QC$TKDQ3DKDRBNOD $TKDQCDBNMUNKUDC ,@FMHSTCDQDK@SHUD Figure 4. R-band light curves for the four lensed images of the z = 0.658 quasar RX J1131−1231. The photometry for the 707 epochs is obtained from deconvolution photometry. The three colours used to display the data points correspond to four different instruments/telescopes. 17)l ! L@F " # L@F 3NS@KDONBGR 2, 132 LDONBGR $TKDQDONBGR ,DQB@SNQDONBGR curve are uncorrelated, as each quasar image is magnified by different stars of the lensing galaxy. ')# l C@X ,@FMHSTCDQDK@SHUD ')# l C@X lensing: individual stars of the lensing ­galaxy, in the foreground of a given quasar image, act as additional gravitational lenses and further distort and magnify the latter. This effect is illustrated in Figure 5. While the image distortions remain undetectable even at high spatial reso­lution, the apparent increase in size YRNTQBD (­magnification) yields a change in total flux, since gravitational lensing conserves ­surface brightness. The stars move relative to the line of sight on orbits within the galaxy and the resulting fluctuating magnifications significantly perturb the light curves of the quasar images. The microlensing perturbations seen in each light YKDMR KHFGSC@XR LHBQN@QBRDB 4MKDMRDCPT@R@Q ,@BQNLHBQNKDMRDCHL@FD While quasar microlensing is highly interesting on its own and can be used as a natural telescope to zoom into the inner parts of quasar accretion discs (for a review, see, e.g., Schmidt & Wambsganss, 2010; Eigenbrod et al., 2008; and also ESO Release eso08471), it also p ­ erturbs the time delay measurement. We have therefore devised a set of new numerical techniques to measure the time delays and to accurately estimate their uncertainties, even in the presence of microlensing variability (Tewes et al., 2012a). Applying these techniques to RX J1131−1231, the delays between the three close images A, B and C are compatible with being zero, and we measure the delay of image D to be 91 days, with a fractional uncertainty of only 1.5 % (1σ), including systematic errors (Tewes et al., 2012b). Our monitoring data, deconvolution photometry technique and “curve shifting” methods are now all sufficiently tested and accurate that the uncertainties in the time delay measurements no longer dominate the total error budget of the cosmological inferences, as has long been the case. Follow-up observations for accurate lens models While medium-size telescopes are used to measure the delays, VLT spectroscopy of the lensing galaxy and of other massive intervening galaxies along the line of sight is a key step in building the models needed to interpret the delays. In parallel, Figure 5. Toy model of quasar microlensing by stars of a galaxy at z = 0.3, which acts as a gravitational lens on a quasar at z = 0.6. The represented field of view is only 20 micro-arcseconds on a side. At such a huge spatial resolution, we clearly see the original quasar image (left) distorted and magnified by microlensing due to solar-mass stars, represented by the + symbols (right). With real observations, we can only observe the integrated flux of this scene. The Messenger 150 – December 2012 51 Astronomical Science Tewes M. et al., COSMOGRAIL deep HST or ground-based adaptive optics imaging is crucial to reveal the ­Einstein rings formed by the host galaxies of the lensed quasars. These highly distorted extended images, if bright enough, strongly constrain the radial mass profile of the lensing galaxy, and therefore are a key ingredient in linking the delay measurements to cosmology. results were then published without any further modification. The combination of RX J1131−1231 with only one other quasar lens — also performed in Suyu et al. (2012) — further reduces these uncertainties, as all known systematic errors are under control. Prospects COSMOGRAIL illustrates very well the complementarity between astronomical facilities and combines many techniques of optical astronomy: (1) mediumsize telescopes to carry out the longterm photo­­metric monitoring; (2) HST or VLT with adaptive optics to constrain the lens models using high ­resolution imaging; (3) deep VLT spectroscopy to measure redshifts and to constrain the dynamical mass model. In the future, JWST and the E-ELT will allow the 2D velocity field of the lensing galaxies to be mapped and Einstein rings to be imaged with exquisite quality, especially using image deconvolution techniques. References Claeskens, J.-F. et al. 2006, A&A, 451, 865 Eigenbrod, A. et al. 2008, A&A, 490, 933 Magain, P., Courbin, F. & Sohy, S. 1998, ApJ, 494, 472 Refsdal, S. 1964, MNRAS, 128, 307 Schmidt, R. W. & Wambsganss, J. 2010, Gen. Rel. and Gravit., 42, 2127 Suyu, S. et al. 2012, arXiv:1208.6010 Tewes, M. et al. 2012a, arXiv:1208.5598 Tewes, M. et al. 2012b, arXiv:1208.6009 Walsh, D., Carswell, R. F. & Weymann, R. J. 1979, Nature, 279, 381 Links 1 ESO release on microlensing in the Einstein Cross: http://www.eso.org/public/news/eso0847/ With the large number of lensed quasars that remain to be discovered in forthcom- ESO/P. Grosbøl By building a state-of-the-art lens model of RX J1131−1231, Suyu et al. (2012) show that our delays of the single lens RX J1131−1231 already lead to impressive constraints. The resulting cosmological parameter inference depends on the assumed cosmological model. For the case of a spatially flat universe in which the behaviour of dark energy is parametrised by its equation-of-state parameter, w, the combination of RX J1131−1231 with the WMAP7 dataset gives: H0 = 8 −1 80.0+– 5. Mpc−1, Ωde = 0.79 ± 0.03, 5.7 km s + 0.17 and w = –1.25 – 0. 21. Interestingly, this analysis was carried out with a purposely “blind” approach. The absolute inferred values of the cosmo­logical parameters were revealed only once all members of our collaboration were satisfied with their part of the data analysis, and these ing surveys, notably in the southern hemisphere, the time delay technique has a promising future in providing stringent and independent constraints on cosmology. In the mean time, the ~ 20 currently monitored COSMOGRAIL targets and their follow-up with present-day facilities will already lead to results that are highly competitive with much more expensive cosmological probes. Near-infrared representative colour image of the nearby prototypical barred spiral galaxy NGC 1300 taken with HAWK-I on the VLT. The filters used were Y (shown here in dark blue), J (in light blue), H (in green), and K (in red). This galaxy of type SB is at a distance of about 19 Mpc, has a central supermassive black hole and the spiral arms show many young clusters. The image size is about 6.4 arcminutes. More details can be found in Release eso1042. 52 The Messenger 150 – December 2012
