The Time Delay in Human Vision
advertisement

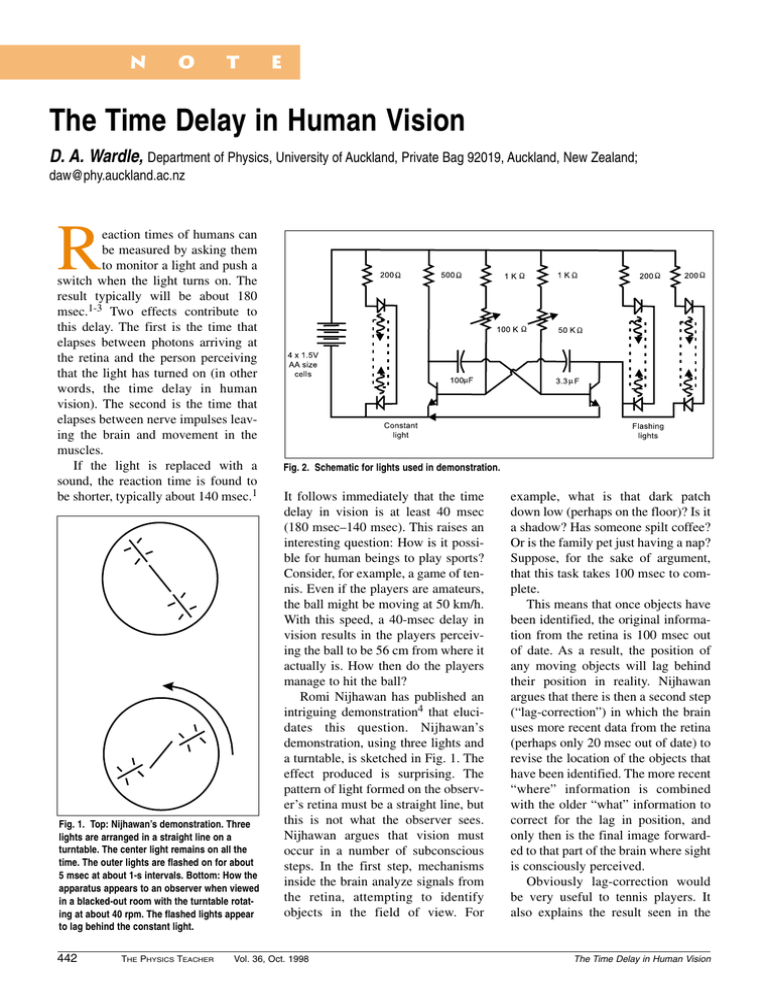
N o t e The Time Delay in Human Vision D. A. Wardle, Department of Physics, University of Auckland, Private Bag 92019, Auckland, New Zealand; daw@phy.auckland.ac.nz R eaction times of humans can be measured by asking them to monitor a light and push a switch when the light turns on. The result typically will be about 180 msec.1-3 Two effects contribute to this delay. The first is the time that elapses between photons arriving at the retina and the person perceiving that the light has turned on (in other words, the time delay in human vision). The second is the time that elapses between nerve impulses leaving the brain and movement in the muscles. If the light is replaced with a sound, the reaction time is found to be shorter, typically about 140 msec.1 Fig. 1. Top: Nijhawan’s demonstration. Three lights are arranged in a straight line on a turntable. The center light remains on all the time. The outer lights are flashed on for about 5 msec at about 1-s intervals. Bottom: How the apparatus appears to an observer when viewed in a blacked-out room with the turntable rotating at about 40 rpm. The flashed lights appear to lag behind the constant light. 442 THE PHYSICS TEACHER Fig. 2. Schematic for lights used in demonstration. It follows immediately that the time delay in vision is at least 40 msec (180 msec–140 msec). This raises an interesting question: How is it possible for human beings to play sports? Consider, for example, a game of tennis. Even if the players are amateurs, the ball might be moving at 50 km/h. With this speed, a 40-msec delay in vision results in the players perceiving the ball to be 56 cm from where it actually is. How then do the players manage to hit the ball? Romi Nijhawan has published an intriguing demonstration4 that elucidates this question. Nijhawan’s demonstration, using three lights and a turntable, is sketched in Fig. 1. The effect produced is surprising. The pattern of light formed on the observer’s retina must be a straight line, but this is not what the observer sees. Nijhawan argues that vision must occur in a number of subconscious steps. In the first step, mechanisms inside the brain analyze signals from the retina, attempting to identify objects in the field of view. For Vol. 36, Oct. 1998 example, what is that dark patch down low (perhaps on the floor)? Is it a shadow? Has someone spilt coffee? Or is the family pet just having a nap? Suppose, for the sake of argument, that this task takes 100 msec to complete. This means that once objects have been identified, the original information from the retina is 100 msec out of date. As a result, the position of any moving objects will lag behind their position in reality. Nijhawan argues that there is then a second step (“lag-correction”) in which the brain uses more recent data from the retina (perhaps only 20 msec out of date) to revise the location of the objects that have been identified. The more recent “where” information is combined with the older “what” information to correct for the lag in position, and only then is the final image forwarded to that part of the brain where sight is consciously perceived. Obviously lag-correction would be very useful to tennis players. It also explains the result seen in the The Time Delay in Human Vision demonstration. The lag-correction mechanism is effective for the constantly illuminated light and it is seen with the 20-msec delay. But the flashing lights present a problem. The brain identifies that two lights have appeared, but when it tries to revise their locations, more recent data from the retina indicates that they are no longer there. The lag-correction mechanism is foiled and they are seen with a 100-msec delay in the position in which they were flashed. The two different delays explain why the flashed lights appear to lag. Recently I constructed a copy of Nijhawan’s demonstration and exhibited it at our university’s visitors’ day. It proved very popular. Building the demonstration is simple and inexpensive. The lights I used are white plastic drinking straws, cut to length (10 cm), with an LED in either end. These are mounted in a straight line on a piece of black cardboard. The electronics used to drive the lights is shown in Fig. 2. I used high brightness LED’s with a yellow/green color, operating Fig. 3. How a straight drinking straw, constantly lit by a single LED and rotating on a turntable, appears to an observer. Apparent bending depends on position of LED. The Time Delay in Human Vision with a current of about 7 mA. The current is determined by the 200-⍀ resistors. Flashing is achieved using the standard transistorized astable multivibrator circuit, described in many books on electronics.5 For transistors, I used the BC549C, but any small signal npn transistor should work equally well. The 100-k⍀ trim pot determines how long the lights are on, and the 50-k⍀ trim pot, how long they are off. I built our turntable, but since the demonstration works well at speeds of 33 rpm and 45 rpm, an old record-player turntable would be a simpler option. As well as demonstrating Nijhawan’s result, the apparatus also showed another effect. The straight lights actually appeared slightly curved when constantly illuminated and rotating on the turntable. To investigate this further, we simplified the pattern of lights, as shown in Fig. 3. There we see that the faintest part of the light always lags behind the brightest part, indicating that the delay in human vision is intensity dependent. This result has actually been known for many years and is the basis of the famous Pulfrich illusion.6,7 Nijhawan has gone on to publish two equally intriguing demonstrations based on the lag-correction effect. These use the apparatus shown in Fig. 4. In one demonstration,8 the rectangle is green and the line red. When the turntable is stationary, the observer sees the line as Fig. 4. Additional lag-correction-effect demonstrations for an observer in a blacked-out room. The rectangle is mounted on the turntable and constantly illuminated. The line, which appears for about 5 msec, is an image produced by a projector. The projector is synchronized with the rotation of the turntable so that the line is always superimposed on the center of the rectangle. Vol. 36, Oct. 1998 THE PHYSICS TEACHER 443 yellow (because of color mixing of the red and green components). With the turntable rotating, the flashed line is perceived to lag behind the center of the rectangle. If the turntable speed is large enough, the flashed line lags so much that it no longer overlaps the rectangle and appears against the black background. It then looks red! In another demonstration,9 the rectangle is white. The line is also white, but has a small gap in the center. When the turntable is stationary, the observer does not perceive the gap because of the poor contrast between the white line and the white background of the rectangle. But once again, if the turntable is rotated sufficiently fast, the line is perceived to lag so much that it appears against a dark background. The gap in the line is then clearly visible! Acknowledgments I would like to thank Andrew Somervell and Geoff Bold for their help with the visitors’ day exhibit and Alastair Duhs and Romi Nijhawan for enjoyable and enlightening discussions. References 1. Reaction Times, edited by A. T. Welford (Academic Press, London, 1980). 2. H. T. Hudson, Phys. Teach. 22, 245 (1984). 3. David G. Willey, Phys. Teach. 23, 314 (1985). 4. Romi Nijhawan, Nature 370, 256–257 (1994); see also Nature 378, 565–566 (1995). 5. For example, A. van der Ziel, Introduction to Electronic Circuits (Allyn and Bacon, Boston, 1969), p. 151. 6. Martin Gardner, Phys. Teach. 33, 117 (1995). 7. Jearl Walker, The Flying Circus of Physics (Wiley, New York, 1977), sections 5.117 and 5.122. 8. Romi Nijhawan, Nature 386, 66–69 (1997); see also pages 19 and 21 of the same journal. 9. R. Nijhawan, Invest. Ophthal. Vis. Sci., Suppl. 35, 1277 (1994). Golf Is a Mysterious Sport How many of you, during a tedious airplane flight, have picked up from the seat pocket in front of you that odd catalog that offers to sell novel items at outrageous prices? Some items are quite interesting. Recently I came across the little item shown in the figure. It aims to sell a new golf club—an “iron.” Not being a golfer, I have not tried it, and it may well be a very good investment. However, read the description and examine the diagram, and then think, “Is this correct?” It reminds me of those puzzles that say, “What is wrong with this picture?” First, if you examine the position of the center of mass of the clubhead, if it indeed has the cross section shown and is uniform, the center of mass could not possibly be that high. Of course, if you include the shaft it might be, but that would not seem to be fair. Second, look at the arrows shown (which presumably represent forces). Could they possibly be correct? The left-hand diagram would seem to be correct: the club would deliver backspin to the ball, which, because of the Bernoulli effect, would make it travel farther. However, if the contact point with the ball is correct in the right-hand figure, the force on the ball must pass through the point of contact and inevitably give 444 THE PHYSICS TEACHER Vol. 36, Oct. 1998 By using graphite and brass in the clubhead, S - - - - Irons concentrate the center-of-gravity at or below the ball contact point. Steel irons are top-heavy. S - - - - ’s low center of gravity delivers more mass, more power, and more backspin to the ball automatically. it backspin, unless the ball shot up in the air and not in the general direction in which the club is moving—or would it? Draw in what you think the forces should be. It seems to me that the S- - - - club may be better because of the lower center of mass, but not for the reasons given. I would like to hear the opinion of others on this. Ron Edge Physics Department University of South Carolina Columbia, SC 29208 The Time Delay in Human Vision


