Rulers of the Universe: Parallax
advertisement
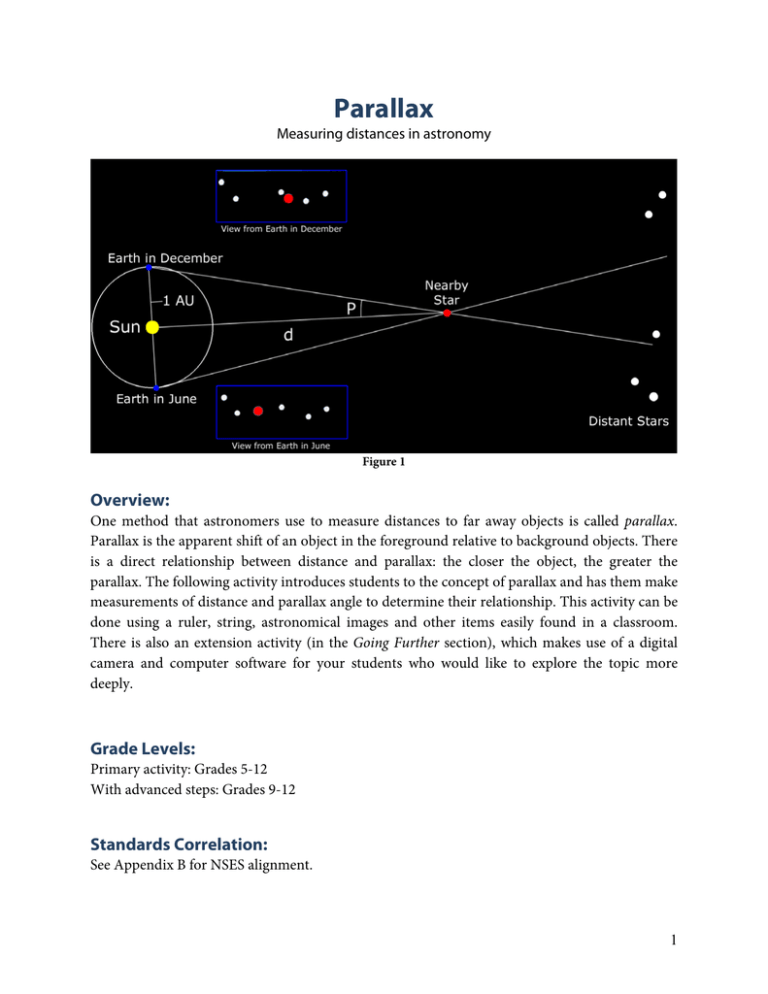
Parallax Measuring distances in astronomy Figure 1 Overview: One method that astronomers use to measure distances to far away objects is called parallax. Parallax is the apparent shift of an object in the foreground relative to background objects. There is a direct relationship between distance and parallax: the closer the object, the greater the parallax. The following activity introduces students to the concept of parallax and has them make measurements of distance and parallax angle to determine their relationship. This activity can be done using a ruler, string, astronomical images and other items easily found in a classroom. There is also an extension activity (in the Going Further section), which makes use of a digital camera and computer software for your students who would like to explore the topic more deeply. Grade Levels: Primary activity: Grades 5-12 With advanced steps: Grades 9-12 Standards Correlation: See Appendix B for NSES alignment. 1 Objectives: • Students will measure parallax angles at a variety of distances from a target object in the classroom using either a ruler or an angle measuring tool. • Students will graph the relationship of parallax and distance. • Students will compare their graphs to the analytic formula for parallax and explore why their observations deviate from a theoretical prediction. • Students will observe how parallax changes with distance and use this technique to determine distances to far away objects, including stars. Connection to Other Activities: This activity is the second in a package of three activities called “Rulers of the Universe”. It can be used on its own, but it can also be prefaced by the “Size and Scale of the Universe” activity, and followed up by the “Inverse Square Law” activity. They can both be found at http://wise.ssl.berkeley.edu/education_class.html Time: Between 50 to 100 minutes (1 to 2 50-minute class sessions): Materials: For each group of students: Meter stick or measuring tape Tape A stand to hold star image (e.g., tripod, music stand, coat/hat rack) Push pin Centimeter ruler or angle measuring device (AMD) (substitute for ruler in Appendix C) Printed galaxy image (Appendix C) Printed star image (Appendix C) Group Instructions (Appendix C) Diagram of Station Set-Up (Appendix C) For each student: Student data table (Appendix D) Graph paper (Appendix D) Student Worksheet (Appendix D) Calculator that can compute sin, cos, and tan functions Grading: Please refer to the Evaluate section at the end of this Teacher Guide. 2 Getting Ready: Gather the materials listed above and separate them into stations for each group (3 to 5 students per group). 1. Print enough data tables and graph paper for each student in your class. Each group’s galaxy-star-baseline station should be set up as follows (Consider setting up the galaxy–star–baseline stations parallel to each other. This will eliminate any conflicting lines-of-sight between groups of students. If possible, move obstructions—such as student desks—out of the way.) : 2. Tape a galaxy image (Appendix C) on a wall at students’ eye level height. Helpful Hint Make sure the baseline is at a right angle. The formula for comparing students’ data to the theoretical measurements is based on a straight line that creates a 90° angle between the galaxy and the center of the baseline. If this line is not straight, the activity will still work but students will not be able to compare their data to the theoretical measurements. 3. On the opposite side of the room (ideally about 9 to 10 meters away) from the galaxy image, place a “baseline” (a meter stick or 1-meter length of masking tape) perpendicular to the line between the galaxy image and the baseline. Set the center of this baseline (50 cm) to intersect the line between it and the galaxy image. On the line between the center of the baseline and the galaxy, measure and mark off 1-meter increments starting at the baseline (see Figure 2). For optimal results, you should mark off at least 7 places, including the baseline (a distance corresponding to 6 meters between all marked places). 4. Figure 2 (larger image in Appendix C) 3 5. Tape the star image on a stand that can move back and forth across the room (e.g., a coat rack or a music stand). Make sure to place the star at the same height as the galaxy image on the wall. Construct an angle measuring device (AMD) for each group of students: 6. Print the degree scale (Appendix C) or use a ruler with centimeter tick marks. 7. Cut a piece of string about 70 cm in length. Fasten the string to the center of the degree scale or ruler by using a pushpin, tape, or tying a knot. Starting where the string is attached to the scale/ruler, measure 57 cm on the length of string and tie a knot or mark it at the 57 cm point. (See Figure 3) Figure 3: Angle measuring device Helpful Hint Why is the string on the AMD 57 cm? The AMD is calibrated so that 1-cm on your scale/ruler is equivalent to 1°. Thus, setting the angle θ to be 1°, let L = 1 cm. The length of the string, s, may be calculated from the following equation: 𝐿 tan 𝜃 = 𝑠 𝐿 s= tan 𝜃 1 𝑐𝑚 𝑠= tan(1°) = 57.3 𝑐𝑚 ≈ 57 𝑐𝑚 4 Engage Procedure: 1. Introducing Parallax: Point to a small stationary object on the classroom wall (such as a clock) and ask students to close one eye, extend a hand out to arms’ length, and cover the clock in their vision with their thumb. Then, instruct students to keep their hand/thumb still and switch eyes (close the other one). Ask them switch eyes back and forth several times and notice what happens. Ask them the following questions: • What did you notice? • Did your thumb physically move? • How did your thumb appear to move? • What could explain your thumb’s apparent movement? 2. Parallax and Distance: Tell students to move their thumb closer to their face while switching eyes. Ask them the following questions: • How does the apparent motion of your finger change? • What is it about your eyes that enables you to see this apparent motion? • If you could make your arm longer (i.e. increase the distance between your eye and your finger), would you expect your finger’s apparent shift to increase or decrease? Why? Explain to your students that parallax is the apparent shift of an object in the foreground relative to distant background objects. In this case, the foreground object is your thumb, while the background object is the clock. The change in your thumb’s apparent position relative to the background clock is due to a change in the viewer’s position. In this case, the “viewer” is your left eye and then your right eye. Because your eyes are separated by distance of a few centimeters, the viewing positions of your left and right eyes are different! 3. Real-World Applications of Parallax: The following discussion points can help you to provide motivation for the parallax activity. • Depth perception: Because your eyes are at two different locations on your head, when you view an object, each of your eyes sees it from a slightly different angle or perspective. Your brain uses this information to perceive depth. This is why you can see in three dimensions. 5 • 3-D movies: Scenes in 3-D movies are shot by at least two different cameras, which are separated by a distance that is similar to the distance between human eyes (about 5 cm). As you watch the movie while wearing 3-D glasses, images from both cameras are coming to your glasses at the same time. The right-hand camera’s image is filtered out by the glass over the left eye, but is allowed through to the right eye. The left-hand camera’s image is filtered out by the glass over the right eye, but is allowed through to the left eye. This creates the illusion of 3-D depth. • Motion parallax: Have you ever wondered why pigeons bob their heads up and down? Their eyes are so far apart that they do not have overlapping fields of view; so they bob their heads to get different viewpoints and see depth in each eye. • Astronomy: Astronomers use parallax to measure distances to stars. By measuring the amount that a given star appears to shift when observed from different perspectives in Earth’s orbit, geometry can be used to infer the distance to the star. Explore and Explain Measuring Parallax: 1. Assign students to groups (3-5 per group) and distribute materials (Appendix C & D). Consider grouping students together by height. If all students in the group have roughly the same eye level it will reduce the need to crouch to line up the galaxy and star. 2. Have the students follow the directions on each group’s instruction sheet (Appendix C) 3. Each student should fill out his/her own Student Data Table, Graph Sheet, and Student Worksheet (Appendix D) 4. Use the table in Appendix B to determine the correction factor, Δ, for each groups’ set-up. Provide them with that value. 5. Continue to the Discussion Notes (page 9) once everyone is finished with their worksheets. 6 Going Further (optional): This following extension activity makes use of additional technology: a digital camera and a computer with image-downloading software are used by the students to make measurements of the angle between the star and the background galaxy. In addition to the materials from the previous activity, the following materials are required for the extension activity. • Digital camera with equipment to transfer images to a computer. • A tripod (for consistency and stability). • Digital camera calibration scale (A ruler or the copy master provided in Appendix C) • Computer running Salsa J software http://www.euhou.net/index.php?option=com_content&task=view&id=8&Itemid=10 1. Camera calibration: Hold the AMD so that the numbers are facing the camera lens and the zero is in the center of the star. Making sure that the string is taut, hold the free end of the string just beneath the lens. Take a picture. You will later use this image to determine the calibration scale. You only need to do this step once. 2. Place the stand with the star image at the 1-meter marker. Make sure the image of the star is directly over the spot on the floor. 3. Place the tripod holding the camera on the left side of the baseline facing the galaxy. Adjust the height of the tripod so that it is level with both the star and the galaxy image. Look through the eye of the camera and make sure that the center of the lens is aligned with the center of the star. Take a picture. Later on, you will use this image to measure the angle A between the star and the galaxy. Figure 6 7 4. Move the tripod to the right side of the baseline and repeat the above step to measure the angle B between the star and the galaxy. 5. Move the stand to the 2-meter marker. Repeat the procedure for measuring A and B as described above. 6. Continue with the same procedure for the star stand at the 3, 4, 5, 6, and 7-meter distances. 7. Using Salsa J or other appropriate software, download the images from the camera. 8. Use the image containing the AMD to determine your calibration scale. For instance, 1 cm on the AMD might correspond to 0.75 cm on the computer screen image, or 12.5 pixels (measured using SalsaJ’s Straight Line Selection Tool ). 9. Measure the angle between the star and galaxy, A’ and B’, in each image. Use the calibration scale determined above to determine A and B for each location of the star stand. 10. Use the table in Appendix B to determine the correction factor, ∆, for your setup. 11. To determine the parallax angle for each distance, use the parallax formula: 𝑃 =𝐴+𝐵+ ∆ 12. For each parallax measurement, calculate the theoretical distance to the star using 𝑑theoretical = 𝑟 tan(𝑃/2) 13. Plot d versus P on the graph paper, as well as 𝑑theoretical versus P. You may choose to use the graph paper provided in Appendix D. 14. Following the discussion notes at the end of this activity is an example data table and graph, which contains data points as well as theoretical curve. 8 Elaborate Discussion Notes: After finishing the activity, discuss the following questions and talking points with your students. • • As you moved the star stand further away from you, what happened to the angle you measured between the star and the galaxy? Compare your plot of distance versus parallax with the theoretical distance versus parallax. Did you tend to overestimate or underestimate the parallax? The fact that your measurements probably do not line up exactly with the theoretical curve means that there were sources of error in your measurements. What might account for some of these errors in your measurements? Sources of error: Distances calculated in this exercise and by astronomers may be overestimated or underestimated in comparison to the true distance of a given object. A bit of thought reveals possible sources of random and systematic error. Systematic error: If your measurements are consistently greater than or consistently less than true values, this is a likely indication of systematic or repeated errors. For instance, if the scale is calibrated incorrectly (e.g. the string wasn’t exactly 57cm long), this would factor into each measurement in the same way and could be accounted for. Random error: Taking measurements from the same device (your AMD, for instance) several times in the same conditions is unlikely to produce the exact same value for each measurement. This is called random error. An indication of this type of error is that on your graph, your measured data points are randomly distributed above and below the theoretical curve. While random errors are expected because measurements are always inherently imperfect (e.g. the student didn’t stand exactly the same way for each measurement), you should try to account for and eliminate systematic errors when possible. Specific possibilities (not exhaustive): • The string wasn’t exactly 57cm long • The student made small slightly off measurements with their eye • Because the students use the same eye on each side of the baseline, there is a small difference in the distance from the center of the baseline (related to the distance between their eyes). This could cause one of the angle measurements (A or B) to be consistently larger than the other. Continued on next page… 9 Discussion Notes continued… • The student didn’t consistently stand in the exact same way (maybe leaned forward at times) • The student didn’t hold the string taut every time • The stand with the star image was not placed over the spot precisely each time. Parallax is the apparent displacement of an object when observed from different perspectives. By measuring parallax angles and using simply geometry, you can indirectly determine distances to objects. This principle is used in astronomy to calculate the distances to nearby stars, which appear to change position in the sky relative to more distant, fixed stars, over the course of a year. The further away an object is the less it appears to shift positions, thus celestial bodies that are very far from Earth can be treated as a stationary “background” that acts as a stationary frame of reference for nearby stars. The parallax angle of a star is measured by observing the star’s location with respect to the background at different times of year. Over the course of six months, the line of sight to a given star will subtend an angle in the sky that can be used to measure its distance. Since parallax angles are very small (fractions of a degree), this method is only effective for measuring distances to stars that are relatively close to Earth (within about 100 light-years). The distance to about 100,000 stars have been measured in this way. The distances to more remote stars have been measured using the “cosmic distance ladder.” Even the parallax angles of nearby stars are very small, and astronomers are careful to make accurate and precise measurements. Discuss how the following considerations help to improve on accuracy (how close a measurement of a quantity is to the true value) and precision (the extent of repeatability of a measurement). • • • The use of a very long baseline is advantageous for parallax measurements. What is the longest baseline that astronomers can use for earth based parallax measurements? (Answer: twice the distance between the earth and sun.) Astronomers use telescopes with high resolution to take parallax measurements. Resolution is the ability to discern details of an object, like a star. Astronomers have taken multiple parallax measurements of individual stars to improve the precision of their measurements. 10 Evaluate There are five questions on the Student Worksheet that students can answer after they have finished the activity. The total possible points is 100, and the recommended grading for each question is: • Question 1 = 15 points • Question 4 = 25 points • Question 2 =15 points • Question 3 = 15 points • Question 5 = 30 points Grading Rubric: Question 1: Distance and parallax • Full credit (15 points) – The student correctly explains that the distance to a star increases as parallax decreases. • Partial credit (8 points) – The student gives an incomplete answer. • No credit – The student indicates an incorrect correlation between distance and parallax. Question 2: Arcsecond – the unit of parallax • Full credit (15 points) – The student shows proper mathematical steps, such as the use of ratios, and arrives at the correct answer (0.72 arcseconds). • Partial credit (8 points) – The students shows proper mathematical steps but obtains the incorrect answer. • No credit – The student shows incorrect steps and obtains the wrong answer. Question 3: Parsec – the unit of distance • Full credit (15 points) – The student shows proper mathematical steps, such as the use of ratios, and arrives at the correct answer (1.29 parsecs). • Partial credit (8 points) – The students shows proper mathematical steps but obtains the incorrect answer. • No credit – The student shows incorrect steps and obtains the wrong answer. Question 4: Distance to a star • Full credit (25 points) – The students shows proper mathematical steps and arrives at the correct answers for parts (a; 2.85 pc) and (b; 6.06 pc). • Partial credit (15 points) – The students shows proper mathematical steps but obtains the incorrect answer for (a) or (b). • Partial credit (5 points) – The students shows proper mathematical steps but obtains the incorrect answer for both (a) and (b). 11 • No credit – The student shows incorrect steps and obtains the wrong answer for both parts. Question 5: What astronomers see • Full credit (30 points) – The student answers in the ranges for all 3 of the following: (a) Parallax of Star A is about 0.13 arcsec (between 0.105 – 0.150) (b) Parallax of Star B is about 0.076 arcsec (between 0.055 – 0.090) (c) The distance to Stars A is about 7.69 pc (between 6.67 – 9.52) and Star B is about 13.16 pc (between 11.11 – 18.18) • Partial credit (20 points) – The student gets 2 out of 3 correct answers. • Partial credit (10 points) – The student gets 1 correct answer. • No credit – The student gets incorrect answers for all 3 parts. Example Data: Here is an example table, using a correction factor of 8.2 (corresponding to 7 meters): d (meters) A (degrees) B (degrees) P (degrees) r / tan(P/2) (meters) 1 24.5 22.5 55.2 0.96 2 9.5 9.0 26.7 2.1 3 5.5 4.9 18.6 3.1 4 3.3 2.8 14.3 4.0 5 1.8 1.6 11.6 4.9 6 0.7 0.5 9.4 6.1 7 0.2 0.1 8.5 6.7 12 Example Graph – Measured & Theoretical Distance Distance versus Parallax 14 12 Distance (m) 10 8 6 4 2 0 0 10 20 30 40 50 60 70 80 90 100 Parallax (degrees) distance (theory) distance (measured) Appendix A: Standards Correlation National Science Education Standards (content) Grades 5-8 Systems, order, and organization Evidence, models, and explanation Change, constancy, and measurement Abilities necessary to do scientific inquiry Understandings about scientific inquiry Grades 9-12 Systems, order, and organization Evidence, models, and explanation Change, constancy, and measurement Abilities necessary to do scientific inquiry Understandings about scientific inquiry Abilities of technological design (Going Further section) Understandings about science and technology (Going Further section) 13 Appendix B: Correction Factor In real-world applications of stellar parallax, the distance to the background, fixed stars is so far away, that the angle between each end of the baseline and the line-of-sight to the background stars is essentially 90o. But in this activity, since the background galaxy which the students are using to measure parallax is not “infinitely” far away but is relatively close to the star whose parallax is being measured, the angle to the background galaxy image is less than 90o. To account for this, we define a correction factor, Δ which depends on the distance between the baseline and the galaxy image. ∆ = 180° − (𝑎 + 𝑏) = 2 tan −1 (𝑟/𝐷) = 2 tan −1 (0.5 𝑚/𝐷) Advanced students can measure the distance between the baseline and the galaxy image taped to the wall and do some trigonometry to estimate the correction factor. However, values for Δ corresponding to various distances are also provided in Table 1 below. D (meters) 6 7 8 9 10 11 Δ (degrees) 9.5 8.2 7.2 6.4 5.7 5.2 Appendix C: Copy Masters for each group (pages 15- 20) • • • • • Galaxy image Star image Scale for the angle measuring device Group instructions (2 pages) Diagram of station set-up Appendix D: Copy Masters for each student (pages 21-24) • • • Student data table Graph paper Student Worksheet (2 pages) 14 15 16 Group Instructions (page 1 of 2) - Measuring Parallax The “Diagram of Station Set-Up” and the image below show the configuration for a galaxy-starbaseline station. The footprints indicate where you should stand to measure the parallax angles. 1. Place the star stand at the 1-meter marker. Make sure the image of the star is directly over the spot on the floor. 2. Face the galaxy and position yourself on the left side of the baseline. Adjust your height so that your eye is level with both the star and the galaxy. Make sure the tips of your toes are at the edge of the baseline. Using the AMD: In one hand hold the scale (ruler) of the angle measuring device (AMD) so that the numbers are facing you. With the other hand, hold the string at the 57 cm mark just below your eye (see images on next page). Make sure the string is taut. It does not matter which eye you use, just be sure to use the same eye for all measurements. (If you switch eyes, you may get slightly different measurements. This is due to the parallax effect of the space between your eyes.) Be careful to keep your eye in line over the baseline. For example, try not lean forward or backward over the baseline. Have other students watch the observer’s eye to make sure it is lined up with the baseline. 3. Making sure the string is taut, hold the AMD so that the zero is in line with the center of the star. Measuring the distance between the star and the center of the galaxy. This angle will be A. Record A on your data sheet at the 1-meter distance. 17 Group Instructions (page 2 of 2) Figure 5: Holding the angle measuring device. Make sure to hold the string taut. 4. Move to the right side of the baseline. Repeat the measurement between the star and the galaxy. This angle will be B on your data sheet at the 1-meter distance. 5. Move the stand to the 2-meter marker. Repeat the procedure for measuring A and B as described above. Record the measurements on your data sheet. 6. Continue with the same procedure for the star stand at the 3, 4, 5, 6, and 7-meter distances. Calculating the Parallax: 7. To determine the parallax angle for each distance, use the parallax formula: 𝑃 =𝐴+𝐵+ ∆ Your teacher should provide the value of ∆ (the correction factor). 8. Record the parallax angle, P, on your data sheet for each distance. 9. Plot d (y-axis) versus P (x-axis) on the graph paper. 10. For each parallax measurement, calculate the theoretical distance, to the star using 𝑑theoretical = 𝑟 tan(𝑃/2) 11. Plot the theoretical distance on the same graph as before. 18 Diagram of Station Set-Up: 19 20 Student Data Table Name: __________________________ Date: ___________________________ d (meters) A (degrees) B (degrees) P (degrees) r / tan(P/2) (meters) 21 Name:___________________________ 22 Name:___________________________ Parallax Student Worksheet 1. Distance and parallax: Recall what happened to the distance measured to the star as the parallax angle got smaller. Briefly explain what happens to the distance as the parallax decreases. __________________________________________________________________ __________________________________________________________________ __________________________________________________________________ __________________________________________________________________ 2. Arcsecond – the unit of parallax: Astronomers often measure parallax in units called arcseconds. There are 3600 arcseconds in 1 degree. Proxima Centauri, the nearest star to the Sun has a parallax of about 0.0002 degrees. How many arcseconds is this? (show your work) 3. Parsec – the unit of distance: One of the commonly used units of distance in astronomy is the parsec (pc), which comes from combining the words parallax and second. Proxima Centauri is 4 x 10¹³ km (40 trillion kilometers) from the Sun. Given that 1 pc = 3.1 x 10¹³ km, convert the distance to Proxima Centauri into parsecs (show your work). 23 4. Distance to a star: When parallax is measured in arcseconds and distance is measured in parsecs, the formula relating distance (d) and parallax (p) is simple: d = 1/p WISE astronomers recently discovered several brown dwarfs—objects that were not massive enough to become stars—within 10 pc of the Sun. (a) Find the distance to the brown dwarf, WISE 1541–2250, which has a parallax of 0.351 arcsec (show your work). (b) Find the distance to the brown dwarf, WISE 0254+0224, which has a parallax of 0.165 arcsec (show your work). 5. What astronomers see: The two images below were taken six months apart. There are two stars that have had noticeable shifts in parallax over this time. (a) What is the parallax in arcseconds of Star A? (be as precise as possible) (b) What is the parallax in arcseconds of Star B? (be as precise as possible) (c) Calculate the distances in parsecs to both Stars A and B. 24
