1P1, 2013-14, Mechanical Vibrations: examples paper 2
advertisement
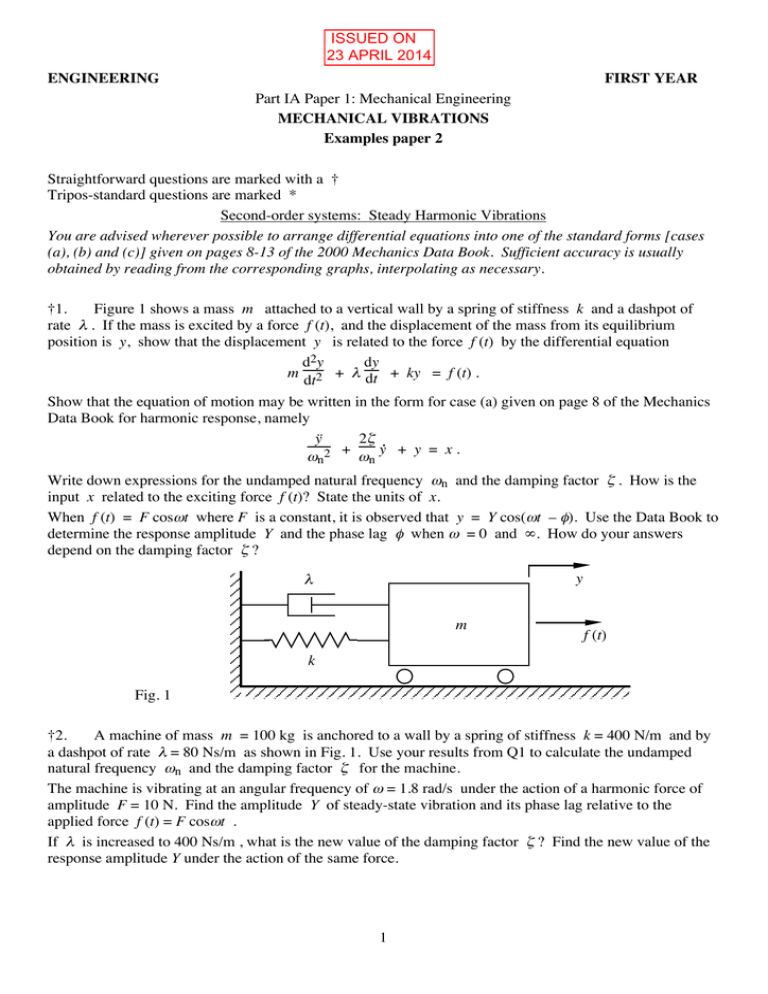
ISSUED ON 23 APRIL 2014 ENGINEERING FIRST YEAR Part IA Paper 1: Mechanical Engineering MECHANICAL VIBRATIONS Examples paper 2 Straightforward questions are marked with a † Tripos-standard questions are marked * Second-order systems: Steady Harmonic Vibrations You are advised wherever possible to arrange differential equations into one of the standard forms [cases (a), (b) and (c)] given on pages 8-13 of the 2000 Mechanics Data Book. Sufficient accuracy is usually obtained by reading from the corresponding graphs, interpolating as necessary. †1. Figure 1 shows a mass m attached to a vertical wall by a spring of stiffness k and a dashpot of rate λ . If the mass is excited by a force f (t), and the displacement of the mass from its equilibrium position is y, show that the displacement y is related to the force f (t) by the differential equation d2y dy m 2 + λ dt + ky = f (t) . dt Show that the equation of motion may be written in the form for case (a) given on page 8 of the Mechanics Data Book for harmonic response, namely ÿ 2ζ + ẏ + y = x . 2 ωn ωn Write down expressions for the undamped natural frequency ωn and the damping factor ζ . How is the input x related to the exciting force f (t)? State the units of x. When f (t) = F cosωt where F is a constant, it is observed that y = Y cos(ωt – φ). Use the Data Book to determine the response amplitude Y and the phase lag φ when ω = 0 and ∞. How do your answers depend on the damping factor ζ ? y λ m f (t) k Fig. 1 †2. A machine of mass m = 100 kg is anchored to a wall by a spring of stiffness k = 400 N/m and by a dashpot of rate λ = 80 Ns/m as shown in Fig. 1. Use your results from Q1 to calculate the undamped natural frequency ωn and the damping factor ζ for the machine. The machine is vibrating at an angular frequency of ω = 1.8 rad/s under the action of a harmonic force of amplitude F = 10 N. Find the amplitude Y of steady-state vibration and its phase lag relative to the applied force f (t) = F cosωt . If λ is increased to 400 Ns/m , what is the new value of the damping factor ζ ? Find the new value of the response amplitude Y under the action of the same force. 1 †3. In a simple AC ammeter, the recorded current ir is related to the input current ii by the differential equation 2 1 d ir 1 dir + 16 dt2 4 dt + ir = ii . Find the undamped natural frequency ωn and the damping factor ζ for oscillations of the instrument. When the input current is given by ii = Ii cos ωt, the steady-state recorded current is ir = Ir cos(ωt – φ). If the recording error is defined as |Ir – Ii| / Ii , find the maximum error over the range of angular frequency from 0 to 4 rad/s . 4. The equivalent mass, stiffness and damping factor of a fan blade vibrating at low frequency is determined experimentally by applying a sinusoidally varying force of amplitude 5.8N at a given point on the fan blade at various frequencies. The following values of steady-state oscillation at the driving point are obtained: frequency (Hz) response amplitude Y(mm) 0 14 16 18 20 22 24 26 0.10 0.19 0.24 0.34 0.40 0.29 0.19 0.13 Within this frequency range, the fan blade can be regarded as a system with one degree of freedom (as shown in Fig. 1) comprising a mass m attached to a spring k and a dashpot λ . A sinusoidal force f (t) is applied to the mass. By considering only the response at low frequency (the static response) , find the spring constant k. The maximum amplitude of response occurs when the frequency of excitation is 20Hz. Use the formula for Ymax given on page 8 of the Mechanics Data Book to estimate the damping factor ζ. (Hint: first assume that ζ << 1 and then check this assumption.) Estimate the damped resonant frequency ωr and calculate the undamped natural frequency ωn . Hence find the equivalent mass m and the equivalent dashpot rate λ for the fan blade. Write a short Matlab/Octave program to plot the points from the table above on the same axes as the Data Book formula using your estimated parameter values, and compare. 5. Fig. 2 shows a mass m attached to a vertical wall by a spring of stiffness k and a dashpot of rate λ. The mass is attached to another spring of stiffness k to a point B which moves horizontally. The horizontal displacements of the mass and the point B from their equilibrium positions are denoted by y and z respectively. By considering the sum of forces acting on the mass, derive the equation of motion for the trolley. Show that it can be put into the form ÿ 2ζ + ẏ + y = x 2 ωn ωn giving expressions for ωn and ζ . What is the input x in terms of z? For k = 0.5 N/m , m = 1 kg , λ = 0.8 Ns/m and z = 100 cos 0.8t (mm), find the amplitude of the displacement y and its phase lag φ relative to z. Draw a phasor diagram (i.e. a diagram on the complex plane) showing the quantities Y and Z. The clockwise angle from Z to Y is the phase lag φ. On the phasor diagram, indicate the quantity Z – Y and hence obtain the magnitude and phase (relative to z) of the force that must be applied at B to maintain the motion. (Note: these graphical results can be checked by means of complex algebra by substituting x = X eiωt and y = Y eiωt into the differential equation. You may prefer to obtain phasor diagrams in this way.) 2 y λ z m B k k Fig. 2 6. A simple pendulum comprises a bob of mass m at the end of a light string of length l, the top end of which is fixed at a point P as shown in Fig. 3(i). Damping is modeled by a viscous dashpot λ acting between the frame and the bob as shown. Draw a free-body diagram of the bob to show that small oscillations of the pendulum (in the absence of any damping) are governed by the differential equation m d2y +λ dy mg + l y = f (t) dt dt 2 where y is the horizontal displacement of the bob from its equilibrium position and f(t) is a time-varying horizontal force applied to the bob. Show that this equation corresponds to case (a) in the Data Book. Instead of applying a force f(t) to the bob, vibration is excited by means of a time-varying horizontal motion x(t) of the frame as shown in Fig. 3(ii). With reference to your free-body diagram, show that small oscillations are now governed by the differential equation d2y + g λ dx g + l y = + x l m dt m dt λ dy dt 2 and show that this equation corresponds to case (c) in the Data Book. Now instead of measuring the absolute motion y of the bob, we measure motion z = y – x of the bob relative to the frame as shown in Fig. 3(iii). Show that small oscillations are governed by the differential equation d 2z + λ dz d2x g z = – 2 dt l + dt 2 m dt and show that this equation corresponds to case (b) in the Data Book. P x (t) x (t) l m y (i) f (t) y (ii) Fig. 3 3 z (iii) 7. A seismic vibration transducer contains a mass m suspended on a spring k and a dashpot λ as shown in Fig. 4. The absolute vertical displacements of the mass and of the box are y and x respectively. The motion of the mass relative to the casing is given by z = y – x. First consider the response when the casing is at rest (x = 0). Take the mass as a free body and show that free vertical motion of the mass is governed by the differential equation d2y dy m 2 + λ dt + ky = 0 . dt Include gravity in your derivation and show that gravity can be ignored if y is measured from the equilibrium position of the suspended mass. When used as a seismic vibration transducer, the relative displacement z is monitored by producing a trace of z(t) on a roll of paper because there is no reference for absolute measurements during an earthquake. For x ≠ 0 , make appropriate substitutions into the differential equation above to give d2z dz d2x m 2 + λ dt + kz = – m 2 . dt dt Show that this can be written in a form corresponding to case (b) in the Data Book. Steady sinusoidal earth motion x = X cos ωt gives rise to steady sinusoidal transducer response z = Z cos(ωt - φ ). At high frequencies the response amplitude Z and the earth motion X are almost the same, but 180° out of phase. Explain why. By choosing an appropriate value of damping factor ζ, it is possible to limit the response at resonance so that the measurement error |(Z/X) – 1| is small, despite the resonance. If an acceptable error is 20%, find the value of ζ that gives the maximum working frequency range for the transducer. What is this working range if ωn = 10 rad/s ? Calculate the damped resonant frequency of this device. 8. A mass m is supported on a spring of stiffness k in parallel with a dashpot of rate λ as shown in Fig. 5. The floor moves vertically with amplitude x and the mass responds with amplitude y. By considering the sum of forces acting on the mass, show that y is related to x by the differential equation d2y dy dx m 2 + λ dt + ky = λ dt + kx dt and that this corresponds to case (c) in the Data Book. An electron microscope of mass 100 kg is to be mounted on springs to isolate it from floor vibrations. For frequencies at or above 12 Hz, the microscope must not be subject to vertical vibration amplitudes in excess of 5 µm, while below 12 Hz, an acceptable vibration amplitude is 200 µm. Measurements show that a nearby machine produces sinusoidal floor vibration of amplitude equal to 40 µm at many frequencies. For the case of zero damping, find the undamped natural frequency for the spring mounting that gives rise to acceptable vibration levels of the microscope at 12 Hz. (Hint: use the appropriate formula for Y / X in the Data Book with ζ = 0.) What stiffness of springs is required to achieve this isolation? Calculate the value of the damping factor required to limit the response at resonance to an acceptable level. The performance of the vibration isolation system is worsened by the addition of damping, yet a compromise is necessary because some damping is needed to limit response at resonance. With spring stiffness and damping ratio as calculated above, calculate the microscope vibration amplitude at 12 Hz when the floor vibration amplitude is 40 µm. Compare your answer with the desired level of 5 µm. 4 k λ y m y x m z k x λ floor Fig. 4 (for Q. 7) Fig. 5 (for Q. 8) *9. A caravan may be modelled as a mass m supported on an axle via a spring of stiffness k in parallel with a viscous dashpot of rate λ as shown in Fig. 6. Show that the absolute vertical displacement of the caravan is related to the absolute vertical displacement of the axle x by d2y dy dx m 2 + λ dt + ky = λ dt + kx dt where y and x are both measured upwards from the equilibrium position. A particular caravan has m = 500 kg, k = 20 kN/m and λ = 2000√5 Ns/m . It is towed at a constant velocity V along a bumpy road whose surface profile varies sinusoidally with an amplitude X of 25 mm and a wavelength L of 7.5 m so that the axle displacement is 2πV x = X cos ωt, where ω = L and the caravan displacement is y = Y cos (ωt – φ ) . Find the damping factor ζ and the amplitude of vibration Y when the velocity V = 50 km/h . The road exerts a force f vertically upwards on the axle. Show that f = – F cos (ωt – φ ) + m g where F = mω2 Y . Hence find the amplitude F of the harmonic road force when V = 50 km/h . V y x L F Fig. 6 5 10. Consider a mass-spring-dashpot oscillator, with a natural frequency 100 Hz and a damping factor ζ = 0.03. Write a Matlab/Octave program to draw a graph of the impulse response, from P7 of the Mechanics Data Book, as a function time over the period 0.4 s, with a time step 0.0003 s. With the same time axis, make a vector of values of a sinusoidal signal at a chosen frequency f, then use the Matlab function CONV to calculate the response of the oscillator to this input signal by convolution. Explore the cases f = 80, 100, 110, 150 Hz. In each case identify the transient and the steady harmonic response. Answers 1. 2. 3. 4. 5. 7. 8. 9. k /m , λ / 2 km , x (t) = f (t) / k in metres , F /k , 0° and 0 , 180° 2 rad/s , 0.2 , 0.061 m , 62° , 1 , 0.014 m 4 rad/s , 0.5 , 16% 58 kN/m , 0.125 , 126 rad/s , 128 rad/s , 3.5 kg , 113 Ns/m 2k /m , λ /2 2km , z/2 , 68 mm , 60° (lag) , 0.043 N , – 43° (lead) 0.47 , 1.32 Hz to ∞ , 2.13 Hz 4 Hz , 63 kN/m , 0.1 , 5.8 µm 0.71 , 0.020 m , 1350 N For further practice, the following Tripos questions from Paper 1 are suitable: 2011 Q10; 2010 Q12; 2009 Q12 J Woodhouse Easter 2014 6
