SIA-Smaart® Pro Technical Note
Volume 1, Revision 2, March 1999
SIA Software
Company, Inc.
#4
Page 1
How Signal Alignment Affects the Quality
of Transfer Function Measurement Data
We are often asked just how critical it really is to set the proper delay for signal alignment in Transfer Function measurements. We will attempt to answer that question
here. In this technical note, we will explore what happens when we send exactly the
same signal to both computer sound inputs and then intentionally disalign the two
input signals (in time) by adding delay on one input channel.
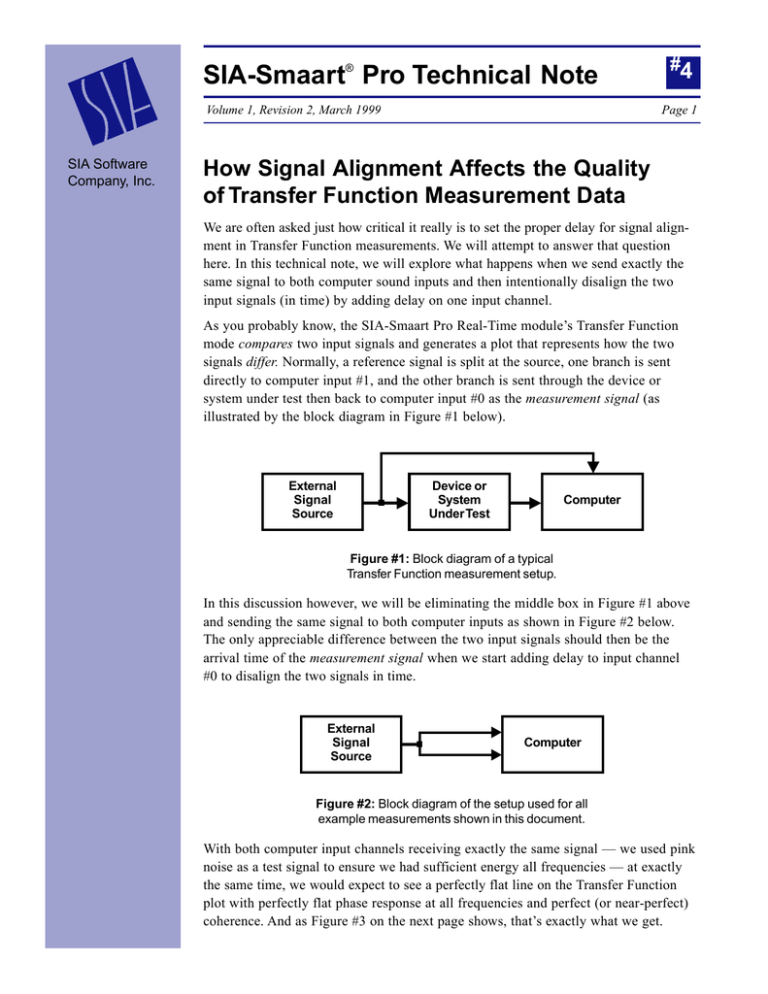
As you probably know, the SIA-Smaart Pro Real-Time module’s Transfer Function
mode compares two input signals and generates a plot that represents how the two
signals differ. Normally, a reference signal is split at the source, one branch is sent
directly to computer input #1, and the other branch is sent through the device or
system under test then back to computer input #0 as the measurement signal (as
illustrated by the block diagram in Figure #1 below).
External
Signal
Source
Device or
System
Under Test
Computer
Figure #1: Block diagram of a typical
Transfer Function measurement setup.
In this discussion however, we will be eliminating the middle box in Figure #1 above
and sending the same signal to both computer inputs as shown in Figure #2 below.
The only appreciable difference between the two input signals should then be the
arrival time of the measurement signal when we start adding delay to input channel
#0 to disalign the two signals in time.
External
Signal
Source
Computer
Figure #2: Block diagram of the setup used for all
example measurements shown in this document.
With both computer input channels receiving exactly the same signal — we used pink
noise as a test signal to ensure we had sufficient energy all frequencies — at exactly
the same time, we would expect to see a perfectly flat line on the Transfer Function
plot with perfectly flat phase response at all frequencies and perfect (or near-perfect)
coherence. And as Figure #3 on the next page shows, that’s exactly what we get.
SIA-Smaart Pro Technical Note No. 4
v1.r1.4/99 — Page 2
Figure #3: Magnitude and phase measurement of one signal
sent to both computer input channels. Note that in this example,
no delay has been applied to either input signal.
The measurement shown in Figure #3 above was made using 24-point per octave
FPPO resolution in Transfer Function mode. Pink noise was used as the test signal.
Notice that the signal levels for both channels was -12db below full scale to allow for
the crest factor of the source signal used. A look at the Real-Time module’s Coherence
function showed that all frequencies below 18.5 kHz had coherence values above
0.98 (i.e., virtually perfect coherence).
Figure #4 on the next page tells a different story. In Figure #4, the measurement setup
and all input parameters were identical to those used in Figure #3 with one exception;
a delay of 0.50 milliseconds was added to the measurement signal on analog input
channel 0 (the green trace in 2-channel RTA mode) using the Real-Time module’s
internal signal delay. As a result, the reference signal (on channel #1) and the measurement signal (on channel #0) are out of alignment (in time) by 0.5 milliseconds.
The effect of adding this delay can be seen two ways. First, the phase plot shows
significant phase shift at higher frequencies. Since the wrapped phase display was
used in this example, you can see the phase plot “wrapping” above 1000 Hz where the
amount of phase shift exceeded -180°, forcing the trace to jump to the top of the plot
(i.e., wrap) to continue the curve downward. If you were to unwrap the phase display
(by pressing the [U] key) and zoom out ([Alt] + [+]) a few times, you would see that
the phase shift in the measurement signal is in excess of -2500° at 16 kHz!
SIA-Smaart Pro Technical Note No. 4
v1.r1.4/99 — Page 3
Figure #4: Magnitude and phase measurement of one signal sent to
both computer input channels. All measurement parameters are identical
to those used in figure #3 except that 0.50 milliseconds of delay
has been applied to the measurement signal on input channel #0.
The fact that the first “wrap” in the phase trace shown in figure #4 occurs at exactly
1000 Hz is no accident. “1000 Hertz” is just another way of saying 1000 complete
cycles per second. One full cycle can be expressed as 360 degrees. Therefore, at 1000
Hz, each full 360° cycle lasts 1/1000 of a second or 1.0 milliseconds. We delayed the
measurement signal relative reference signal in this example by 0.5 milliseconds so at
1000 Hz, the relative time difference between the two signals is equal to one half of
one full cycle or 180 degrees!
The misalignment between the two input signals can also be seen in the magnitude
response plot (the “standard” Transfer Function plot in the lower half of the display).
Notice that at higher frequencies the Transfer Function trace becomes more and more
erratic compared to figure #3.
Another result of time misalignment of the input signals is a drop in coherence. The
coherence function in Smaart Pro provides direct information about the quality of the
data displayed in Transfer Function mode. The coherence function is typically used to
answer the following three questions:
1. Was there enough energy at a given frequency to make a valid measurement?
2. Was there too much noise at a given frequency to make a valid measurement?
3. Are the two input signals properly aligned (in time)?
SIA-Smaart Pro Technical Note No. 4
v1.r1.4/99 — Page 4
In Figure #5 (see below), the same signal is sent to both inputs of Smaart and the FPPO
transfer function is calculated. A delay of 2.0 milliseconds has been added to the
reference input signal. The resulting graph shows an erratic frequency response at
frequencies above 1kHz, and phase wrapping that begins at 250Hz. Again, this is as
expected. At 250 Hz, one full 360° cycle takes four milliseconds so delaying one
signal by 2 milliseconds should result in 180 degrees of relative phase shift.
Figure #5: The Transfer Function Coherence display. All frequencies that fall below
the selected coherence level (as indicated on the slider below the magnitude display)
are indicated by a vertical red line in the magnitude plot. As you can see, almost all
frequencies above 1kHz indicate a drop in coherence due to the misalignment (in time)
of the two input signals resulting from a 2 millisecond delay applied to input channel 0.
The measurement results displayed in Figures #4 and #5 should help to demonstrate
the importance of insuring that the proper delay times are used when making transfer
function measurements. Also, these examples show how the phase display and
coherence function can be used to help you “see” possible time misalignment in
transfer function measurements.
A Publication of SIA Software Company, Inc.
One Main Street
Whitinsville, MA 01588
USA
telephone: 508-234-6158
e-mail: support@siasoft.com
www.siasoft.com
SIA – an EAW Company
Copyright 1999 SIA Software Company, Inc. All rights reserved.


