RL circuits Goals: • Construction of an inductor with desired
advertisement

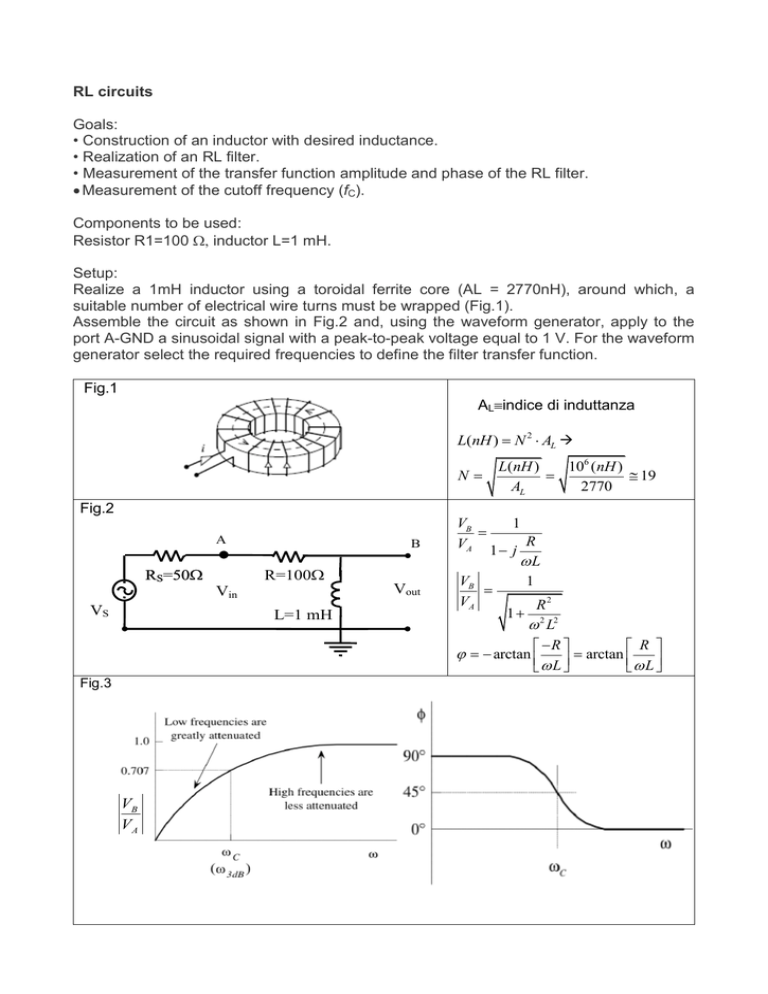
RL circuits Goals: • Construction of an inductor with desired inductance. • Realization of an RL filter. • Measurement of the transfer function amplitude and phase of the RL filter. Measurement of the cutoff frequency (fC). Components to be used: Resistor R1=100 inductor L=1 mH. Setup: Realize a 1mH inductor using a toroidal ferrite core (AL = 2770nH), around which, a suitable number of electrical wire turns must be wrapped (Fig.1). Assemble the circuit as shown in Fig.2 and, using the waveform generator, apply to the port A-GND a sinusoidal signal with a peak-to-peak voltage equal to 1 V. For the waveform generator select the required frequencies to define the filter transfer function. Fig.1 ALindice di induttanza L(nH ) N 2 AL N L(nH ) 106 (nH ) 19 AL 2770 Fig.2 A RS=50 B R=100 Vout Vin VS L=1 mH Fig.3 VB VA VB 1 VA 1 j R L VB 1 VA R2 1 2 2 L R R arctan arctan L L Measurements to do: 1) For each of the chosen frequencies, by means of the oscilloscope, perform the measurement of the filter transfer function amplitude (measuring signal at the points A and B). 2) For each of the chosen frequencies perform the measurement of the filter transfer function phase. 3) Find the cutoff frequency. 4) Calculate at the considered frequencies the |VB/VA| and values and compare these values with the measured ones. 5) Compare the measured value of fC with: fC 1 2 L / R LCR Circuits Goals: Realization of an LCR resonant circuit and measurement of its frequency response. Detection of the resonance and cutoff frequencies. Estimation of the resonance factor Q and comparison with the theoretical value calculated by the given formula. Components to be used: Resistor R1=R2=1k capacitor: C=47nF, inductor L=1mH. Setup: Assemble the circuit as shown in Fig.1 and, using the signal generator, apply to the port AGND a sinusoidal signal with a peak-to-peak voltage equal to 1V. The trend in magnitude and phase of the circuit response is that of a band-pass filter (Fig.2.). For the frequency response three characteristic frequencies can be identified: • a resonance frequency (where VB=VA·R2/(R1+R2)=V0) • two cutoff frequencies (where |VB|=V0/ 2). A Fig.1 RS=50 VS R1=1 K B + + Vin Vout - L=1mH C=47nF R2=1k - Measurements to do: 1) Changing the frequency of the generator detect the resonance frequency and the two cutoff frequencies. In particular, measure these frequencies using both amplitude and phase of the transfer function. 2) Verify the theoretical value of the resonant frequency: 1 fr 2 L C 3) From the performed measurements (1) calculate Q (Qmea) and compare the obtained value with the estimated value (Qest). fr r Qmea ; Qest r C R1 // R 2 f 2 f1 2 1 Fig.2 VB VA R2 R1 R2 r ################################################################################ From the expression of VB and the definition of Q : VB VA VA R1 1 1 1 1 R1 j C Z2 L R2 1 1 t C R1// R2 t L t t2 VA VA 2 2 R1 R1 1 2 1 2 1 C R1 t R2 t L R2 C R1// R2 1 0 LC t2 t C R1// R2 r2 0 Considering only the positive solutions: 1 C R1// R2 ####################################################################### 2 1


