Application
Note: 476
Accurate and Sensitive All-Ions Quantitation
Using Ultra-High Resolution LC/MS
Mark Sanders1, Josef Ruzicka1, Kevin McHale1, and Petia Shipkova2
1
Thermo Fisher Scientific, Somerset, NJ; 2Bristol-Myers Squibb, Hopewell, NJ
Introduction
Key Words
• Metabolomics
• Exactive
• TSQ Quantum
Access MAX
• Accurate mass
• High resolution
Endogenous metabolite profiling, or metabolomics, is an
extreme example of multi-component quantitation.
Although comparisons are relative in most cases, highquality quantitative results are the key to a successful
study. After potential biomarkers have been found, more
rigorous, absolute quantitative assessments are usually
made to validate the initial observations.
Currently, the triple quadrupole mass spectrometer is
considered the gold standard for quantitation, and
selective reaction monitoring (SRM) techniques are
typically used for the validation of potential biomarkers.
This approach requires MS/MS methods to be developed
for each analyte. As the number of analytes increase, the
more labor intensive the SRM method development
becomes, and the advantages of using a triple quadrupole
diminish. In addition, using smaller SRM dwell times to
accommodate more components across narrow U-HPLC
peaks compromises both quantitative sensitivity and
precision.
In contrast, ultra-high resolution liquid
chromatography-mass spectrometry (LC-MS) provides
sensitive, high-quality, quantitative data. This technique
can provide a simple, relatively unbiased, and highly
quantitative assessment of metabolomics samples,
negating the need for multiple mass spectrometer
platforms. Selectivity for the quantitative measurement is
provided by high resolution mass spectrometry and the
use of narrow mass windows based on compounds’ exact
mass.
Goal
To demonstrate the applicability of using ultra-high
resolution and accurate mass data to obtain high-quality
quantitative data for metabolomic studies.
Experimental Conditions
Sample Preparation
Pooled (male and female) Sprague Dawley rat plasma was
obtained from Bioreclamation, Inc. (Hicksville, NY).
Solutions of commercially available, stable label
endogenous metabolite standards were prepared from
powder obtained from C/D/N Isotopes (Pointe-Claire,
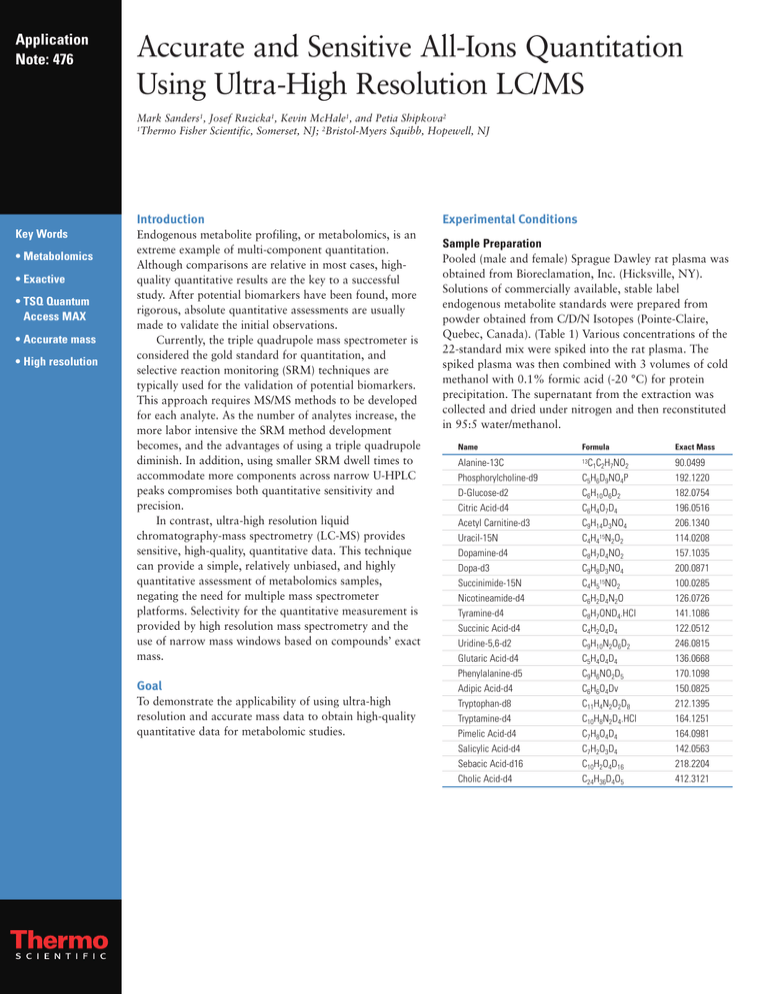
Quebec, Canada). (Table 1) Various concentrations of the
22-standard mix were spiked into the rat plasma. The
spiked plasma was then combined with 3 volumes of cold
methanol with 0.1% formic acid (-20 °C) for protein
precipitation. The supernatant from the extraction was
collected and dried under nitrogen and then reconstituted
in 95:5 water/methanol.
Name
Formula
Exact Mass
Alanine-13C
Phosphorylcholine-d9
D-Glucose-d2
Citric Acid-d4
Acetyl Carnitine-d3
Uracil-15N
Dopamine-d4
Dopa-d3
Succinimide-15N
Nicotineamide-d4
Tyramine-d4
Succinic Acid-d4
Uridine-5,6-d2
Glutaric Acid-d4
Phenylalanine-d5
Adipic Acid-d4
Tryptophan-d8
Tryptamine-d4
Pimelic Acid-d4
Salicylic Acid-d4
Sebacic Acid-d16
Cholic Acid-d4
C1C2H7NO2
C5H6D9NO4P
C6H10O6D2
C6H4O7D4
C9H14D3NO4
C4H415N2O2
C8H7D4NO2
C9H8D3NO4
C4H515NO2
C6H2D4N2O
C8H7OND4.HCl
C4H2O4D4
C9H10N2O6D2
C5H4O4D4
C9H6NO2D5
C6H6O4Dv
C11H4N2O2D8
C10H8N2D4.HCl
C7H8O4D4
C7H2O3D4
C10H2O4D16
C24H36D4O5
90.0499
192.1220
182.0754
196.0516
206.1340
114.0208
157.1035
200.0871
100.0285
126.0726
141.1086
122.0512
246.0815
136.0668
170.1098
150.0825
212.1395
164.1251
164.0981
142.0563
218.2204
412.3121
13
HPLC
Chromatographic analysis was performed using the
Thermo Scientific Accela U-HPLC system. The
chromatographic conditions were as follows:
Column:
Thermo Scientific Hypersil GOLD aQ™
(150 mm × 2.1 mm, 1.9 µm) column
Column temperature: 60 °C
Mobile phase A:
0.1% formic acid in water
Mobile phase B:
0.1% formic acid in acetonitrile/water (98:2)
Flow rate:
0.6 mL/min
Gradient:
Time (min)
A%
B%
0
100
0
6
80
20
8
40
60
12
5
95
13
5
95
13.1
100
0
Total analysis:
14 min
Results and Discussion
The high resolution/accurate mass approach to LC-MS
quantitation is a viable alternative to triple quadrupole
MS/MS techniques when the appropriate resolution is
used. For sensitive, high-quality quantitation using high
resolution/accurate mass data, it is necessary for mass
stability to be maintained over extended periods of time.
Figure 1 shows data from a separate experiment acquired
on the Exactive benchtop Oribtrap mass spectrometer
over the course of a 32-hour data collection. The
instrument was calibrated one hour prior to the analysis.
Over the 32-hour period, the mass drifted only
0.5 millimass units (mmu). Ultra-high resolution
(~75,000 FWHM) was used to observe the changes in
the m/z 261.1304 peak.
261.1096
0 hrs
261.1306
Mass Spectrometry
MS analysis was carried out on either a Thermo Scientific
Exactive benchtop Orbitrap mass spectrometer or a
Thermo Scientific TSQ Quantum Access MAX triple stage
quadrupole mass spectrometer. The source conditions
were the same for both instruments as follows:
261.1093
9 hrs
261.1304
261.1093
18 hrs
Ion source:
Ion source polarity:
Spray voltage:
Vaporizer temperature:
Ion sweep gas:
Ion transfer tube temperature:
Sheath gas pressure (N2):
Auxiliary gas pressure (N2):
Heated electrospray ionization source
(HESI II)
Positive ion mode
3000 V
390 °C
3.0 units
300 °C
60 units
15 units
With the TSQ Quantum Access MAX™ mass
spectrometer, the SRM transitions were measured and
optimized for each analyte. In the first experiment, 25
transitions were monitored with an overall cycle time of
approximately 0.25 s and a dwell time set at 10 ms. In the
second experiment, 100 transitions were monitored at a
dwell time of 2 ms.
With the Exactive™ benchtop Orbitrap mass
spectrometer, generic conditions and an external mass
calibration were used. The instrument was operated in full
scan mode from m/z 75–1000 at 10,000, 25,000 and
50,000 FWHM resolving power.
261.1304
261.1091
32 hrs
261.1301
261.08
261.10
261.12
m/z
261.14
261.16
Figure 1. Spectra from the beginning, middle and end of a 32-hour data
collection on the Exactive benchtop Orbitrap mass spectrometer.
D5-phenylalanine was spiked into rat plasma at
various concentrations and analyzed by U-HPLC/MS.
Figure 2 shows that virtually no change in measured mass
was observed. At 25,000 FWHM resolution, there were
more than sufficient scans to define the 3-second-wide
peaks.
High resolution is critical for high-sensitivity
quantitation in biological matrices when using a singlestage mass spectrometer. Often resolutions of 25,000
Trp
Phenylalanine
166.0860
100
FWHM or more are required to distinguish the analyte of
interest from background interferences. Without the
ability to set the resolution to at least 50,000 FWHM, it
would not have been possible to quantitate certain
compounds at low levels in the plasma samples due to
background interferences. (Figure 3) In this small study of
only 22 analytes, more than one-third required a
resolution greater than 15,000 FWHM to avoid
interferences that would have reduced sensitivity.
NL: 3.20E7
205.0970
Base Peak MS
50
0
100
171.1173
D 5 -Phenylalanine
NL: 2.66E4
171.1167-171.1177
50
2.10
0
100
2.15
171.1172
NL: 2.80E5
171.1167-171.1177
50
0
100
171.1172
NL: 3.00E6
171.1167-171.1177
50
0
100
171.1172
NL: 2.66E7
171.1167-171.1177
50
2.05
2.10
0
0.5
1.0
2.0
1.5
2.5
3.0
3.5
4.0
Figure 2. Maintaining mass accuracy with signal intensity.
D 4 -Dopamine (5 ng/mL)
158.1093
100
D 5 -Phenylalanine (1 ng/mL)
158.1538
R=13989
171.0994
R=12891
100
171.1472
R=8786
10K
158.1205
50
50
10K
171.1745
R=14143
0
Relative Abundance
0
158.1113
100
158.1537
R=33722
50
171.0986
R=31285
100
171.1488
R=31701
25K
25K
50
171.1739
R=32549
0
0
158.1172
100
158.1537
R=63875
158.1110
171.0987
R=58567
100
50K
50
171.1487
R=59677
171.1738
R=63701
50
0
50K
0
158.08
158.10
158.12
158.14
m/z
158.16
158.18
171.05
171.10
Figure 3. High resolution is critical for high sensitivity quantitation in biological matrices.
171.15
m/z
171.20
171.25
When the data obtained for D4-dopamine on the
Exactive and triple quadrupole instruments is compared,
there is very little difference in the quantitative
performance of the two platforms. (Figure 4) However,
the triple quadrupole mass spectrometer appears to be less
selective and shows more chemical noise. Similar results
are observed for D5-phenylalainine. (Figure 5)
Exactive
Level ng/mL
NH 2
HO
HO
2
5
10
20
50
100
200
500
1000
Calc Amt
% Diff
1.8
4.9
10.2
18.9
54.0
104.6
210.7
520.5
961.5
-12.4
-2.4
2.3
-5.7
8.0
4.6
5.3
4.1
-3.9
Calc Amt
% Diff
2.2
5.0
10.3
17.0
44.1
109.4
213.4
503.2
982.5
9.1
-0.1
3.1
-15.1
-11.9
9.4
6.7
0.7
-1.8
Triple Quadrupole
Level ng/mL
2
5
10
20
50
100
200
500
1000
158 → 141
Figure 4. Comparison of the quantitative data obtained for D4-dopamine obtained on the Exactive and triple quadrupole instruments.
Exactive
Level ng/mL
0.4ng/mL
O
OH
NH2
0.4
1
2
4
10
20
40
100
200
Calc Amt
% RSD
0.4
1.0
2.1
4.1
9.5
20.8
39.2
100.3
200.2
7.1
0.9
1.3
1.7
0.1
4.7
2.2
2.0
0.9
% Diff
-1.0
3.9
4.2
3.2
-5.1
4.1
-2.0
0.3
0.1
Triple Quadrupole
Level ng/mL
0.4ng/mL
171 → 106
0.4
1
2
4
10
20
40
100
200
Calc Amt
% RSD
% Diff
0.4
1.1
2.0
4.2
10.4
20.0
40.0
101.6
200.7
6.6
9.0
11.7
6.6
1.5
1.5
2.1
1.1
1.0
0.5
5.4
-1.1
5.4
4.3
-0.1
0.1
1.6
0.3
Figure 5. Comparison of the quantitative data obtained for D5-phenylalanine obtained on the Exactive and triple quadrupole instruments.
The triple quadrupole mass spectrometer performance
is affected by increasing the number of transitions
monitored. At 100 SRM transitions and 2 ms dwell times,
the performance deteriorates as the duty cycle of the triple
1.34
Exactive
1.33
Triple Quadrupole Q 25 SRMs
1.35
quadrupole MS decreases (Figure 6). In contrast, the
Exactive mass spectrometer can efficiently monitor tens of
thousands of channels in 0.25 s without a compromise in
performance.
1.52E6
O
NH 2
1.64E6
N
Nicotinamide
1.21E5
127
84
1.03E5
127
84
8.43E4
127
84
8.50E4
127
84
1.34
1.35
Triple Quadrupole 100 SRMs
1.35
0.6
0.8
1.0
1.2
1.4
1.6
Time (min)
1.8
2.0
Figure 6. The triple quadrupole performance is affected by increasing the number of transitions monitored.
Conclusion
An ultra-high resolution, accurate mass LC/MS system is a
viable alternative to a triple quadrupole mass spectrometer
using SRM for high-quality quantitation, especially when
monitoring a large number of analytes. The Exactive
benchtop Orbitrap mass spectrometer delivers the
necessary mass accuracy, resolution, and speed to provide
sensitive, high-quality quantitation. The instrument setup
and analysis are simplified and MS/MS method
development is not required. Little to no prior information
on the analytes is needed, and data can be reinterrogated
when new analytes are identified. With this unbiased
approach, specific analytes can be targeted and the whole
sample can be surveyed at the same time without
compromising quantitative quality.
2.2
2.4
2.6
Laboratory Solutions Backed by Worldwide Service and Support
Tap our expertise throughout the life of your instrument. Thermo Scientific Services
In addition to these
extends its support throughout our worldwide network of highly trained and certified
offices, Thermo Fisher
engineers who are experts in laboratory technologies and applications. Put our team
of experts to work for you in a range of disciplines – from system installation, training
and technical support, to complete asset management and regulatory compliance
Scientific maintains
a network of representative organizations
throughout the world.
consulting. Improve your productivity and lower the cost of instrument ownership
through our product support services. Maximize uptime while eliminating the
uncontrollable cost of unplanned maintenance and repairs. When it’s time to
enhance your system, we also offer certified parts and a range of accessories and
consumables suited to your application.
To learn more about our products and comprehensive service offerings,
visit us at www.thermoscientific.com.
Africa-Other
+27 11 570 1840
Australia
+61 3 9757 4300
Austria
+43 1 333 50 34 0
Belgium
+32 53 73 42 41
Canada
+1 800 530 8447
China
+86 10 8419 3588
Denmark
+45 70 23 62 60
Europe-Other
+43 1 333 50 34 0
Finland / Norway /
Sweden
+46 8 556 468 00
France
+33 1 60 92 48 00
Germany
+49 6103 408 1014
India
+91 22 6742 9434
Italy
+39 02 950 591
Japan
+81 45 453 9100
Latin America
+1 561 688 8700
Middle East
+43 1 333 50 34 0
Netherlands
+31 76 579 55 55
New Zealand
+64 9 980 6700
Russia/CIS
+43 1 333 50 34 0
South Africa
+27 11 570 1840
Spain
+34 914 845 965
Switzerland
+41 61 716 77 00
UK
+44 1442 233555
USA
+1 800 532 4752
www.thermoscientific.com
Legal Notices
©2009-10 Thermo Fisher Scientific Inc. All rights reserved. C/D/N Isotopes is a trademark of C/D/N Isotopes, Inc., Sprague Dawley is registered trademark of
Harlan Sprague Dawley, Inc. All other trademarks are the property of Thermo Fisher Scientific Inc. and its subsidiaries. This information is presented as an
example of the capabilities of Thermo Fisher Scientific Inc. products. It is not intended to encourage use of these products in any manners that might infringe
the intellectual property rights of others. Specifications, terms and pricing are subject to change. Not all products are available in all countries. Please consult
your local sales representative for details.
Thermo Fisher Scientific,
San Jose, CA USA is ISO Certified.
AN63195_E 11/10S
Part of Thermo Fisher Scientific


