Lighting in Poultry Production
advertisement

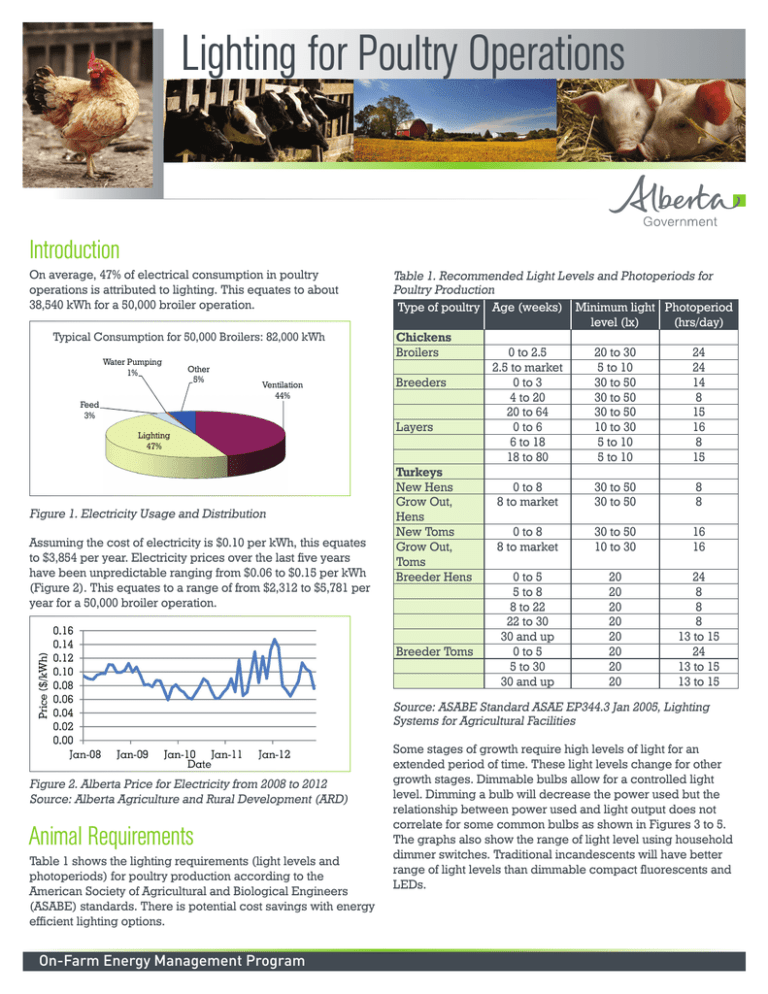
Lighting for Poultry Operations Introduction On average, 47% of electrical consumption in poultry operations is attributed to lighting. This equates to about 38,540 kWh for a 50,000 broiler operation. Typical Consumption for 50,000 Broilers: 82,000 kWh Water Pumping 1% Other 5% Feed 3% Ventilation 44% Lighting 47% Figure 1. Electricity Usage and Distribution Assuming the cost of electricity is $0.10 per kWh, this equates to $3,854 per year. Electricity prices over the last five years have been unpredictable ranging from $0.06 to $0.15 per kWh (Figure 2). This equates to a range of from $2,312 to $5,781 per year for a 50,000 broiler operation. Table 1. Recommended Light Levels and Photoperiods for Poultry Production Type of poultry Age (weeks) Minimum light Photoperiod level (lx) (hrs/day) Chickens Broilers 0 to 2.5 20 to 30 24 2.5 to market 5 to 10 24 Breeders 0 to 3 30 to 50 14 4 to 20 30 to 50 8 20 to 64 30 to 50 15 Layers 0 to 6 10 to 30 16 6 to 18 5 to 10 8 18 to 80 5 to 10 15 Turkeys New Hens 0 to 8 30 to 50 8 Grow Out, 8 to market 30 to 50 8 Hens New Toms 0 to 8 30 to 50 16 Grow Out, 8 to market 10 to 30 16 Toms Breeder Hens 0 to 5 20 24 5 to 8 20 8 8 to 22 20 8 22 to 30 20 8 30 and up 20 13 to 15 Breeder Toms 0 to 5 20 24 5 to 30 20 13 to 15 30 and up 20 13 to 15 Source: ASABE Standard ASAE EP344.3 Jan 2005, Lighting Systems for Agricultural Facilities Figure 2. Alberta Price for Electricity from 2008 to 2012 Source: Alberta Agriculture and Rural Development (ARD) Animal Requirements Table 1 shows the lighting requirements (light levels and photoperiods) for poultry production according to the American Society of Agricultural and Biological Engineers (ASABE) standards. There is potential cost savings with energy efficient lighting options. On-Farm Energy Management Program Some stages of growth require high levels of light for an extended period of time. These light levels change for other growth stages. Dimmable bulbs allow for a controlled light level. Dimming a bulb will decrease the power used but the relationship between power used and light output does not correlate for some common bulbs as shown in Figures 3 to 5. The graphs also show the range of light level using household dimmer switches. Traditional incandescents will have better range of light levels than dimmable compact fluorescents and LEDs. Percent of Total Decrease of Light Output with Power Used 60 Watt Incandescent 100 % of Total Lux % of Total Power 80 60 20 0 2 4 6 Dimmer Level Figure 3. Decrease of Light Output with Power Used; 60 Watt Incandescent Percent of Total Table 2. Lighting Terms and Units Term 40 0 100 90 80 70 60 50 40 30 20 10 0 % of Total Lux % of Total Power Unit 2 4 6 Lumen Total light source output in all directions. The flow of light. Luminous Intensity Candela A point source of light shining in a particular direction. Illuminance Lux (lumens/m2) Density of light falling on a Footcandles plane surface. (lumen/ft2) Luminance Candela/m2 Density of light reflecting off a plane into our eye. Scale 50 to 100 Measure of colour accuracy. 50 is a warm white fluorescent and 100 is an incandescent at a particular colour temperature. Colour Rendering Index (CRI) Figure 4. Decrease of Light Output with Power Used; 15 Watt Dimmable Compact Fluorescent % of Total Lux % of Total Power 0 2 4 Measure of warmth or coolness of the colour of light. 7500 K is blue-white and <2000 K is red. Source: K.Hooper, Lighting Fundamentals Seminar. November 2009 Dimmer Level 100 90 80 70 60 50 40 30 20 10 0 Explanation Luminous Flux Colour Kelvin Temperature 0 Percent of Total Technology Basics, Terminology A Light Program Controller is typically used to set a light level schedule. These controllers can achieve light levels from 1% to 100% and can be programed to simulate dusk and dawn. Typically, they have been used for incandescent or fluorescent lamps. Traditionally, these controllers were not suitable for LED lamps because of the lower current draw but there are controllers available now which have been designed for dimmable LEDs. An alternative is to add a precision dimmer as shown in Figure 6 to the existing controller. This will allow the existing dimmer to dim low current draw lamps such as LEDs to accurate levels. 6 Dimmer Level Figure 5. Decrease of Light Output with Power Used; 6 Watt Light Emitting Diode (LED) Figure 6. A PLS-7200 MR3 Precision Dimmer On-Farm Energy Management Program Applicable Technology Table 3. Comparison of Lamp Types Comparison of Lamp Types Lumens per Watt Average Life (hrs) CRI CCT (K) Incandescent 7 - 20 750 - 1,000 White 100 2,800 Yes 25 - 200 Halogen 12 - 21 2,000 - 6,000 White 100 3,000 Yes 45 - 500 Compact Fluorescent 45 - 55 6,000 - 10,000 White 82 2,7005,000 Yes* 14 - 29 T-12 Fluorescent 62 - 80 9,000 - 12,000 White 52 - 90 3,0005,000 Yes* 30 - 75 T-8 Fluorescent 76 - 100 15,000 - 20,000 White 60 - 86 3,0005,000 Yes* 25 - 59 T-5 Fluorescent 85 - 105 20,000 - 24,000 White 80 - 85 3,0005,000 Yes* 24 - 80 80 60,000 - 100,000 White 80 4,0006,500 Yes* 40 - 400 66 - 90 24,000 Yellow-orange 22 - 70 1,9002,100 No 35 - 1,000 60 - 94 7,500 - 20,000 Bluish 60 - 80 3,0004,300 No 35 - 1,000 4.5 - 150 30,000 - 100,000 White 70 - 95 2,0006,500 Yes 2.5 - 100 Lamp Type Induction High Pressure Sodium Malide Halide LED Colour Instant On Wattage Range Source: Data adapted from manufacture’s literature *Require varying warm-up period There are many lighting technologies available on the market suitable for poultry applications such as incandescent or halogen (Figure 7), high pressure sodium (HPS), fluorescent tubes, and compact fluorescents (CFLs) (Figure 8). Recently, light-emitting diodes (LEDs) (Figure 9) have emerged as an alternative. Figure 7. Incandescent and Halogen Figure 8. Compact Fluorescent Figure 9. Light Emitting Diode (LED) LEDs and fluorescents produce more lumens of light per watt consumed compared to the traditional incandescent and high pressure sodium bulb making them an energy efficient alternative. A 60 watt incandescent is comparable to a 7 watt LED and 14 watt CFL in light output. Table 3 compares light output ratings for common bulbs. It is also important to consider their performance over time if they are being washed. Most bulbs are not washable with direct water spray because they will deteriorate more quickly than the rated bulb life and in some cases may suffer immediate damage. Waterproof figures are available which protect bulbs from water and moisture. The difficulty with LEDs is they have On-Farm Energy Management Program heat dissipation requirements so they should not be mounted in air tight fixtures. This may chance in the future with new waterproof fixture designs entering the marketplace. Watts Cost Analysis of Light Bulbs 800 Lumen Light Output 10 cents per kWh 200 LED (6 Watts) 180 LED Incandescent CFL Incandescent (60 Watts) 160 CFL (15 Watts) Cost per Bulb Current Cost Rated Lifespan (hours) $40 50000 $0.50 1500 $5 10000 Life of Bulb (hours) 140 Cost (Cdn $) Table 4. Lighting Retrofit Case Study 120 100 80 60 40 20 0 0 10000 20000 30000 40000 50000 Time (hours) Figure 10. Cost Analysis of Light Bulbs Shown in Figure 10 is a cost analysis of LEDs and CFLs compared to the standard 60 watt incandescent bulb. With an initial cost of $40 for the LED, the payback would occur after about 6,000 hours which is less than a year if the bulb is on 24 hours a day. The return on investment for a $5 CFL is 1,000 hours or about a month and a half. The payback is reasonable but there are drawbacks to both bulbs. The CFL is not suitable for use in cold temperatures. The LED must be designed with a good heat sink and should not be used in an air tight fixture in order to achieve its rated life span. Both CFLs and LEDs are available as dimmable bulbs but both cost more and may not dim as well as incandescents when used with household dimmer switches. Since LEDs are a relatively new lighting option, the cost is per bulb is decreasing while the efficiency is improving. Case Study The lighting in two poultry barns of identical size was monitored for power consumption from 2010 - 2012 by ARD. In one barn, the existing incandescent bulbs were monitored and after one cycle of chickens (approximately 32 days), the bulbs were retrofitted with LED lights which are designed for use in a poultry barn. In the second barn, fluorescent lights were monitored. Over the course of about two years, the barns were monitored using power loggers set up in each barn. Table 4 shows a summary of the lighting technology used, costs, power used, and simple payback periods. LEDs had the largest retrofit cost but the longest life and the operating cost was low because of the low power draw. Retrofitting incandescents with either fluorescents or LEDs had a realistic payback. On-Farm Energy Management Program Power Draw (max) Total kWh Used per Cycle Energy Cost per Cycle Capital Cost of Bulbs per Cycle Total Cost per Cycle (capital + energy) Simple Payback Period (converting from incandescent) Incandescent Fluorescent LED 60 32 8 $10 ($100 - dimmable $0.50 ballast) 20,000 2,000 (60,000 for ballast) For Entire Barn 6,300 W 2,200 W $60 40,000 840 W 2984 845 337 $298.40 $84.50 $33.70 $22.05 $109.20 $132.30 $320 $194 $166 - 31 Cycles 24 Cycles Summary There are opportunities for energy savings in a typical poultry operation by choosing efficient lighting options. These savings can be achieved by retrofitting inefficient lighting with bulbs having high lumens per watt such as fluorescents, induction, HPS, metal halide, and LEDs. Other important factors to consider are the life span, colour, and if the lamp is instant on. Fluorescents and LEDs have been leading the market as energy efficient options for many applications. The typical consumptions of a 50,000 broiler operation is 38,540 kWh using incandescent bulbs. A saving of $2,954 to $3,404 per year can be achieved by switching to compact fluorescents and LEDs, respectively. There are greater initial costs associated with choosing energy efficient lighting options but the payback period is realistic and constantly improving. References Alberta Agriculture and Rural Development. 2007. OnFarm Energy Audit Report ASABE Standard ASAE EP344.3 JAN2005, Lighting Systems for Agricultural Facilities. Design Recycle Inc. January 2010 www.designrecycleinc.com Hooper, K, Lighting Fundamentals Seminar. November 29, 2009. Lighting Research Centre, January 2010 www.lrc.rpi.edu


