Technical Brief
S-parameters, Insertion and Return Loss
Measurements Using TDR Oscilloscope
Introduction to S-parameters
Frequency-domain scattering parameters (S-parameters) are a useful way to visualize the electrical properties of a system. They are a dual representation of the
time domain data in the frequency domain. S11 is related to Time Domain Reflection (TDR), and S21 is related to Time Domain Transmission (TDT), via an
enhanced FFT algorithm developed in the early 90’s at
the US National Institute of Standards and several universities [1], [2].
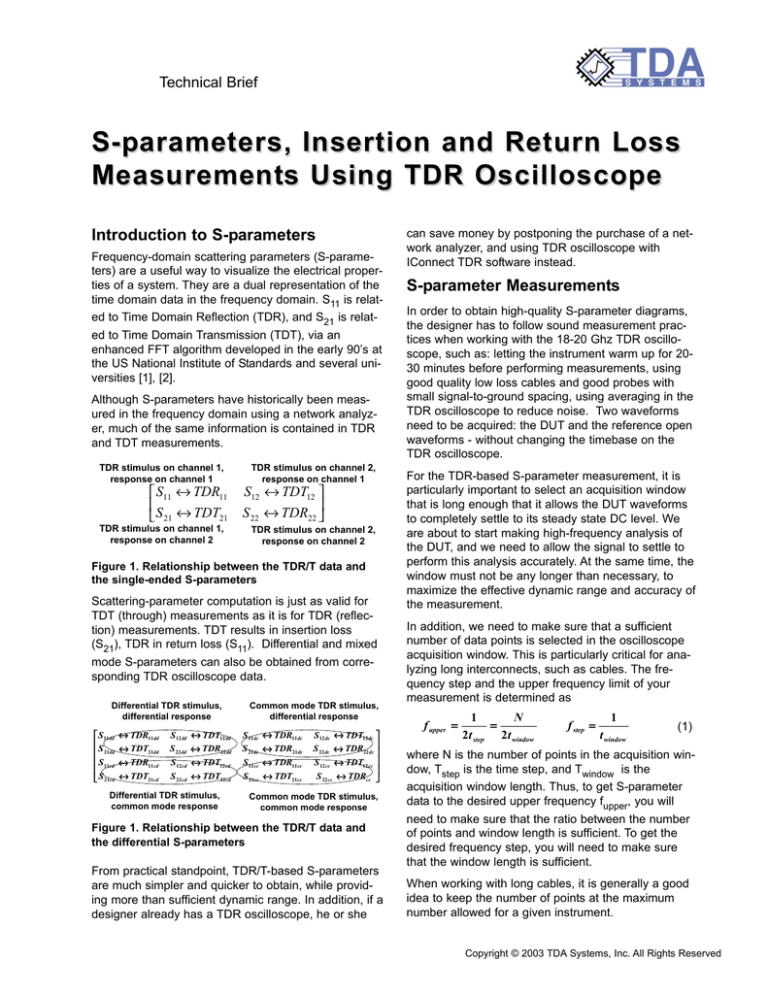
Although S-parameters have historically been measured in the frequency domain using a network analyzer, much of the same information is contained in TDR
and TDT measurements.
TDR stimulus on channel 1,
response on channel 1
S11 ↔ TDR11
S ↔ TDT
21
21
TDR stimulus on channel 1,
response on channel 2
TDR stimulus on channel 2,
response on channel 1
S12 ↔ TDT12
S 22 ↔ TDR22
TDR stimulus on channel 2,
response on channel 2
Figure 1. Relationship between the TDR/T data and
the single-ended S-parameters
Scattering-parameter computation is just as valid for
TDT (through) measurements as it is for TDR (reflection) measurements. TDT results in insertion loss
(S21), TDR in return loss (S11). Differential and mixed
mode S-parameters can also be obtained from corresponding TDR oscilloscope data.
Differential TDR stimulus,
differential response
S 11dd
S 21dd
S 11cd
S 21cd
↔ TDR11dd
↔ TDT21dd
↔ TDR11cd
↔ TDT21cd
S 12 dd
S 22 dd
S 12 cd
S 22 cd
↔ TDT12 dd
↔ TDR22 dd
↔ TDT12 cd
↔ TDT22 cd
Differential TDR stimulus,
common mode response
Common mode TDR stimulus,
differential response
S 11dc
S 21dc
S 11cc
S 21cc
↔ TDR11dc
↔ TDR21dc
↔ TDR11cc
↔ TDT21cc
S 12 dc ↔ TDT12 dc
S 22 dc ↔ TDR22 dc
S 12 cc ↔ TDT12 cc
S 22 cc ↔ TDRcc
Common mode TDR stimulus,
common mode response
Figure 1. Relationship between the TDR/T data and
the differential S-parameters
From practical standpoint, TDR/T-based S-parameters
are much simpler and quicker to obtain, while providing more than sufficient dynamic range. In addition, if a
designer already has a TDR oscilloscope, he or she
can save money by postponing the purchase of a network analyzer, and using TDR oscilloscope with
IConnect TDR software instead.
S-parameter Measurements
In order to obtain high-quality S-parameter diagrams,
the designer has to follow sound measurement practices when working with the 18-20 Ghz TDR oscilloscope, such as: letting the instrument warm up for 2030 minutes before performing measurements, using
good quality low loss cables and good probes with
small signal-to-ground spacing, using averaging in the
TDR oscilloscope to reduce noise. Two waveforms
need to be acquired: the DUT and the reference open
waveforms - without changing the timebase on the
TDR oscilloscope.
For the TDR-based S-parameter measurement, it is
particularly important to select an acquisition window
that is long enough that it allows the DUT waveforms
to completely settle to its steady state DC level. We
are about to start making high-frequency analysis of
the DUT, and we need to allow the signal to settle to
perform this analysis accurately. At the same time, the
window must not be any longer than necessary, to
maximize the effective dynamic range and accuracy of
the measurement.
In addition, we need to make sure that a sufficient
number of data points is selected in the oscilloscope
acquisition window. This is particularly critical for analyzing long interconnects, such as cables. The frequency step and the upper frequency limit of your
measurement is determined as
f upper =
1
N
=
2t step 2t window
f step =
1
t window
(1)
where N is the number of points in the acquisition window, Tstep is the time step, and Twindow is the
acquisition window length. Thus, to get S-parameter
data to the desired upper frequency fupper, you will
need to make sure that the ratio between the number
of points and window length is sufficient. To get the
desired frequency step, you will need to make sure
that the window length is sufficient.
When working with long cables, it is generally a good
idea to keep the number of points at the maximum
number allowed for a given instrument.
Copyright © 2003 TDA Systems, Inc. All Rights Reserved
Furthermore, to increase the dynamic range of the
measurements, it is important to keep number of averages and number of points to the maximum, and the
window as short as possible. 128 averages will give
extra 20dB of dynamic range; use at least that many if
your instrument averages quickly. At the same time, it
is important to keep the acquisition window as short
possible, to maximize the effective power.
Differential S-parameters
When dealing with differential measurements, you
need to make sure that your signals arrive to the DUT
at the same time. You can follow the procedure in the
oscilloscope manual and, having observed the difference in delays between the two channels in differential
mode, adjust for half of that difference by using delta
TDR function in the scope.
For differential, common mode and mixed mode Sparameters, the same applies - a reference and a DUT
waveforms are required. For differential stimulus
waveforms, the oscilloscope must have the two stimulus signals switching in opposite direction. For
common mode stimulus waveforms, the oscilloscope
must have the stimuli switching in the same direction.
For differential response, subtract one response channel from the other. For common mode response, add
the two response channels together.
only TDR (return loss) measurement, the far end of the
device must be terminated with 50 Ohm on each port.
100 Ohm differential termination is acceptable for
differential response measurements.
In differential mode, both transmission and reference
must be differential (that is, negative switching channel
subtracted from the positive switching channel). For a
symmetric interconnect, we can use odd mode
waveforms, acquired on the positive switching channel
with the stimulus being in differential mode.
S-parameter Correlation Data
Despite the simplicity of the S-parameter
measurement process in IConnect, we would like to
address the correlation questions of the S-parameters
obtained in IConnect from TDR/T measurements versus the S-parameters measurements using a vector
network analyzer by providing the correlation data up
to 12 Ghz on Figure 4 below.
Figure 4. Differential insertion loss correlation
With quality fixtures, cables and connectors the Sparameters obtained in IConnect are often accurate
well past 12 GHz.
Bibliography
Figure 3. Fixture settings for differential S-parameter measurements using IConnect TDR software
TDR waveform in the S-parameter computation must
be acquired with the 50-Ohm cables connected to both
DUT ports, thus ensuring a 50-Ohm termination at the
far end of the DUT. The cables, probes and fixtures
used to connect the DUT to both channels of the TDR
oscilloscope are assumed by the IConnect to be of the
same length. Please note that even if you are taking
[1] L.A. Hayden, V.K. Tripathi, "Calibration Methods for
Time Domain Network Analysis,"-IEEE Transactions on
Microwave Theory and Techniques, Vol 41, No. 3, March
1993, pp. 415-421
[2] T. Dhaene, L. Martens, D. De Zutter, "Calibration and
Normalization of Time Domain Network Analyzer
Measurements,"-IEEE Transactions on Microwave Theory
and Techniques, Vol. 42, No. 4, April 1994, pp. 580-589
SPARA-0503
© 2003 TDA Systems, Inc. All Rights Reserved
Data subject to
change without notice
Telephone: (503) 246-2272 Fax: (503) 246-2282
E-mail: info@tdasystems.com Web site: www.tdasystems.com
4000 Kruse Way Pl.#2-300, Lake Oswego, OR 97035 USA
The Interconnect Analysis Company™


