Experiment 11
advertisement

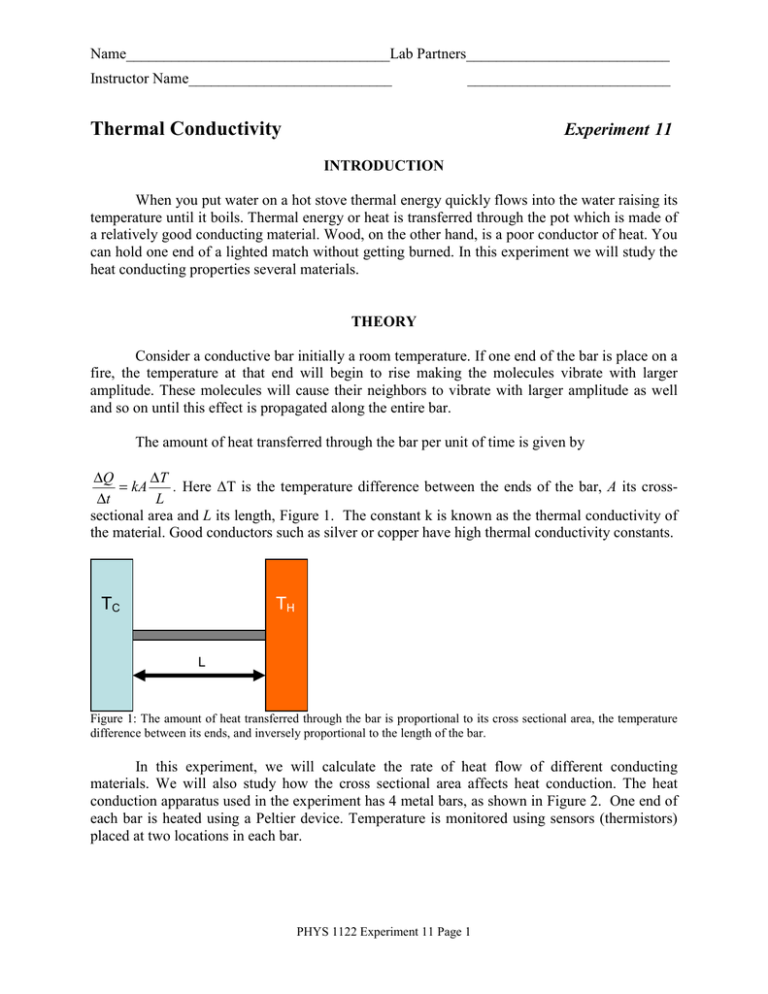
Name___________________________________Lab Partners___________________________ Instructor Name___________________________ ___________________________ Thermal Conductivity Experiment 11 INTRODUCTION When you put water on a hot stove thermal energy quickly flows into the water raising its temperature until it boils. Thermal energy or heat is transferred through the pot which is made of a relatively good conducting material. Wood, on the other hand, is a poor conductor of heat. You can hold one end of a lighted match without getting burned. In this experiment we will study the heat conducting properties several materials. THEORY Consider a conductive bar initially a room temperature. If one end of the bar is place on a fire, the temperature at that end will begin to rise making the molecules vibrate with larger amplitude. These molecules will cause their neighbors to vibrate with larger amplitude as well and so on until this effect is propagated along the entire bar. The amount of heat transferred through the bar per unit of time is given by ΔQ ΔT . Here ΔT is the temperature difference between the ends of the bar, A its cross= kA L Δt sectional area and L its length, Figure 1. The constant k is known as the thermal conductivity of the material. Good conductors such as silver or copper have high thermal conductivity constants. TC TH L Figure 1: The amount of heat transferred through the bar is proportional to its cross sectional area, the temperature difference between its ends, and inversely proportional to the length of the bar. In this experiment, we will calculate the rate of heat flow of different conducting materials. We will also study how the cross sectional area affects heat conduction. The heat conduction apparatus used in the experiment has 4 metal bars, as shown in Figure 2. One end of each bar is heated using a Peltier device. Temperature is monitored using sensors (thermistors) placed at two locations in each bar. PHYS 1122 Experiment 11 Page 1 Figure 2: The Heat Conduction Apparatus allows comparing the heat conduction properties of four conducting bars. One end of the bars is heated by a Peltier device. Temperature readings are taking with thermistors at locations T1 through T8. EXPERIMENT NO. 11 1. In this experiment we will use the left side of the power supply to connect the Heat Conduction Apparatus (HCA). Remove any cables connected to the front panel of the power supply. Turn ON the power supply and check that its output is set to 5V and 0.5 Amp (ask your TA how). Turn OFF the power supply. 2. With the power supply OFF, use two banana patch cords to connect the power supply to the HCA. Connect the positive (+) terminal of the power supply to the red input jack of the HCA; connect the negative (−) terminal of the power supply to the black input jack of the HCA. Set the HCA switch on the upper right corner to HEAT and place the insulators over the bars. Leave the power supply OFF. 3. Open the Thermal Conductivity experiment. 4. In this part of the experiment we want to determine which material (between brass, aluminum, and stainless steel) is a better heat conductor. We will compare temperature readings T1, T5 and T8, see Figure 2. All three temperature readings are taken at an equal distance from the heat source (Peltier Device). By comparing how the temperature changes with time at that distance from the heat source we should be able to determine which material is the best conductor. PHYS 1122 Experiment 11 Page 2 Drag T1 from the data panel and drop it on the Graph icon on the display panel. Then add T5 and T8 in the same way. This will create a single graph showing the three temperature readings as a function of time. 5. Collect a test run, check that all bars are at room temperature (around 20 oC). There might be slight differences in temperature readings between sensors because they have not been calibrated. This difference will not affect your results. If everything is in order delete the test data, go to Experiment and select Delete All Data Runs. 6. Start collecting data wait about 5 seconds and then turn the power supply ON. Your graph will show in real time how the temperature increases in each material. Watch the temperature graph and allow it to increase for about 10 minutes. After 10 minutes stop recording data. Print the graph of temperature (T1, T5, and T8) as a function of time. 7. Which material do you think is the best conductor? Which is the worst? Explain how you reached your conclusions. 8. The three temperature readings used in the previous step were taken by thermistors on the “far” end of each metal bar, see Figure 2. Notice that each bar has a thermistor placed “close” to the heat source as well, for example T1 is the “far” reading of the wide brass plate and T2 its “close” one. Create a T vs. t graph for each material. Each graph must include the “close” and “far” temperature readings of the material. In Table 1, record the moment at which each temperature (“far” and “close”) started to increase. PHYS 1122 Experiment 11 Page 3 Calculate the speed of the heat pulse down each bar. The separation between “far” and “close” thermistors is 3 cm in each case. Show your calculations. Material Brass Aluminum Stainless Steel Table 1 tclose tfar Δt vpulse Is there a correlation between which material was the better heat conductor and which on has a faster velocity? 9. We now need to create a calculation for the temperature difference (ΔT) between the close and far thermistors for all three bars studied above. Click on the Calculate button and then type “DT_brass = T2-T1” under Definition and click Accept. When you are asked to define variables T1 and T2 simply drag them from the Data Panel and drop them where it says Please define variable "T1" (and T2 respectively) in the Calculator Window. Now click on Properties and type “DT” on Variable Name and then “C” under Units. Click OK. The last two steps simply define the name and unit of the new variable you created. Follow this procedure to define ΔT for the other two bars. Be sure to subtract the “far” temperature from the “close” temperature. Display all three calculations in a ΔT vs. t graph. Notice that ΔT reaches a steady state after a few minutes. Which bar has the largest ΔT? PHYS 1122 Experiment 11 Page 4 Which bar has the smallest ΔT? What is the correlation between ΔT and how good a conductor each material is? 10. Why does ΔT peak and then decrease? Why does this peak occur at different times for the bars? Locate the peaks and write down in Table 2 the time at which each occurred. Notice that ΔT in each bar approaches a final equilibrium value. Estimate this final value for each bar and record it in the table. Material Time of ΔT peak ΔT Brass Aluminum Stainless Steel Table 2 11. The rate of heat flow ΔQ/Δt, (in joules per second) is given by ΔQ ΔT , = kA x Δt where k is the thermal conductivity of the material, A is the cross-sectional area of the bar, and x PHYS 1122 Experiment 11 Page 5 is the distance between the thermistors. See the information sheet provided by the TA for the conductivities of brass, aluminum, stainless steel, and the dimensions of the bars. Calculate the final heat flow rate in each bar. Show your calculations. Material ΔQ/Δt Brass Aluminum Stainless Steel Table 3 12. Which bar has the highest heat flow rate? Is there a correlation between ΔT and heat flow rate? 13. We now want to compare the heat conducting properties of the two brass bars. Notice that their widths are different. Which do you think will be the better heat conductor? Explain your answer. 14. Create a graph of ΔT for the narrow brass bar, include the curve for the wide bar in the same plot. PHYS 1122 Experiment 11 Page 6 15. Complete the table below. Material Area ΔT ΔQ/Δt Brass (wide) Brass (narrow) Table 4 Why is ΔT lower in the wide brass bar than in the narrow one? Why is the heat flow lower in the narrow brass bar than in the wide one? QUESTIONS 1. A rectangular house window (h = 1.0m x w = 0.6m) is made of a 1 cm thick glass (k = 0.84 W/(m·K)). How much heat is lost during a period of 10 hours if the inside and outside temperatures are 25 0C and 10 0C respectively? PHYS 1122 Experiment 11 Page 7 2. Two rods, with thermal conductivities k1 and k2, are used to transfer heat between two regions with temperatures TH and TC (TH > TC) as shown. Each rod has length L and cross sectional area A. The rods are first configured in parallel (left) and then in series (right). Which configuration has the largest heat flow rate? Write an expression for the heat flow of each configuration. k2 TC TH TC k1 k2 k1 2L L PHYS 1122 Experiment 11 Page 8 TH


