ADVANCED ELECTRICAL NETWORKS : PROBLEM SET 1
advertisement

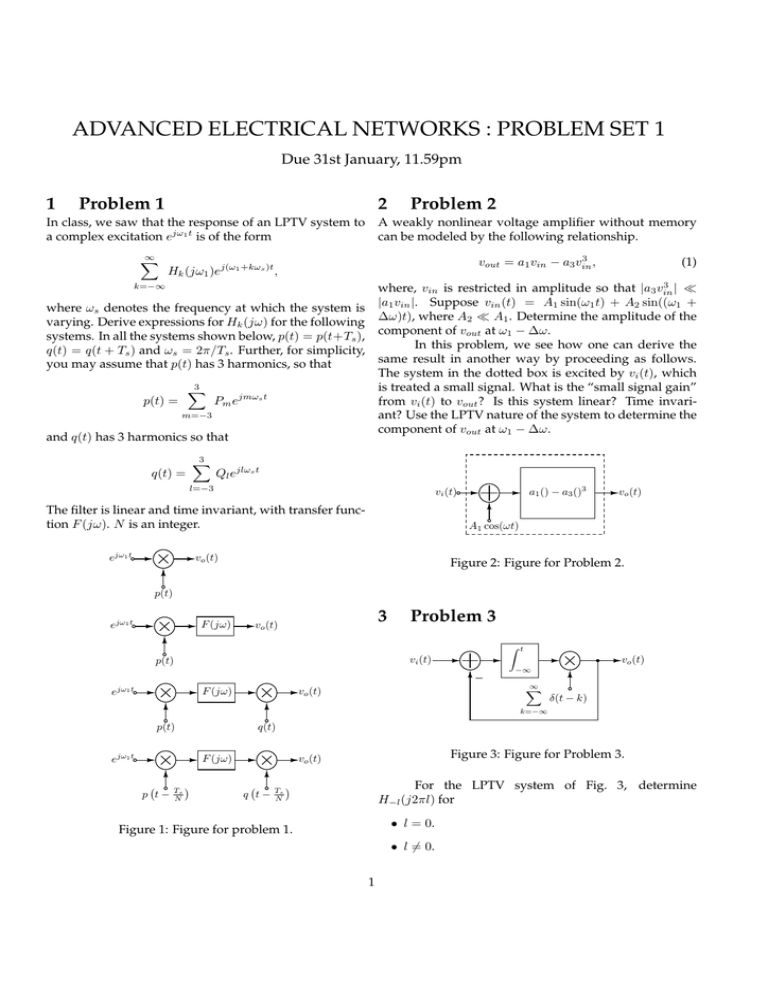
ADVANCED ELECTRICAL NETWORKS : PROBLEM SET 1 Due 31st January, 11.59pm 1 2 Problem 1 In class, we saw that the response of an LPTV system to a complex excitation ejω1 t is of the form ∞ X Problem 2 A weakly nonlinear voltage amplifier without memory can be modeled by the following relationship. 3 vout = a1 vin − a3 vin , Hk (jω1 )ej(ω1 +kωs )t , 3 where, vin is restricted in amplitude so that |a3 vin | ≪ |a1 vin |. Suppose vin (t) = A1 sin(ω1 t) + A2 sin((ω1 + ∆ω)t), where A2 ≪ A1 . Determine the amplitude of the component of vout at ω1 − ∆ω. In this problem, we see how one can derive the same result in another way by proceeding as follows. The system in the dotted box is excited by vi (t), which is treated a small signal. What is the “small signal gain” from vi (t) to vout ? Is this system linear? Time invariant? Use the LPTV nature of the system to determine the component of vout at ω1 − ∆ω. k=−∞ where ωs denotes the frequency at which the system is varying. Derive expressions for Hk (jω) for the following systems. In all the systems shown below, p(t) = p(t+Ts ), q(t) = q(t + Ts ) and ωs = 2π/Ts . Further, for simplicity, you may assume that p(t) has 3 harmonics, so that 3 X p(t) = Pm ejmωs t m=−3 and q(t) has 3 harmonics so that q(t) = 3 X Ql ejlωs t l=−3 a1 () − a3 ()3 vi (t) The filter is linear and time invariant, with transfer function F (jω). N is an integer. ejω1 t (1) vo (t) A1 cos(ωt) vo (t) Figure 2: Figure for Problem 2. p(t) ejω1 t F (jω) 3 vo (t) Problem 3 vi (t) p(t) ejω1 t F (jω) Z t vo (t) −∞ ∞ X vo (t) δ(t − k) k=−∞ p(t) q(t) ejω1 t F (jω) p t− Ts N Figure 3: Figure for Problem 3. vo (t) q t− Ts N For the LPTV system of Fig. 3, determine H−l (j2πl) for • l = 0. Figure 1: Figure for problem 1. • l 6= 0. 1 5 Problem 5 Recall that Hk (jω) is the response of an LPTV system at the frequency ω + kωs to an input of the form ejωt . 4 A signal with bandwidth 1 MHz needs to be sampled by an analog-to-digital converter. For a sampling rate of 5 MHz, determine the minimum order and 3 dB bandwidth of a Butterworth filter needed so that any signal that can potentially alias into the desired signal band is attenuated by atleast 40 dB. Repeat the exercise if the sampling rate is increased to 25 MHz. For each of the sampling rates Problem 4 In class, we derived the transfer function for an nth order Butterworth filter by assuming that its magnitude squared response is of the form |H(jω)|2 = 1 1 + F (ω 2 ) 1. Plot the magnitude responses of the filters in both cases, on the same graph. In the figure, the y-axis must be in dB, and must have a range -60 dB to 10 dB. The x-axis must be in a linear scale, with range 0-30 MHz. F (ω 2 ) had ω = 0 as the point of maximum flatness. We could have chosen an arbitrary frequency ωo in the passband as the point of maximum flatness. This problem develops that line of thought. The desired F (ω 2 ) is shown in Figure 4. As in the case of the Butterworth approximation, we constrain F (1) to be unity. 2. Determine the spread in cutoff frequency allowable, if the order was chosen to be 1 higher than the minimum order you determined above. a. Are there any restrictions on the order of F (ω 2 ), and thereby on the order of the filter ? 6 Problem 6 b. What is F (ω 2 ) for a filter or order n ? Write a MATLAB program to determine the denominator polynomial of an nth order Butterworth filter, with c. Design a fourth order filter of this type, with ωo = a specifiable cutoff frequency ωc . Using your routine to 0.65. After you find F (ω 2 ) proceed just as we did generate the transfer function, plot the impulse response in class - that is, find the LHP roots of D(s)D(-s), of a 10th order Butterworth filter with a 3 dB bandwidth and the resulting D(s). You might find it useful to of 1 Hz. What do you observe ? You might want to use use a computer to find the roots of the appropriate the “impulse” function in MATLAB to generate the impolynomial. Once you have found the denomina- pulse response. tor polynomial, normalize it so that the maximum transmission of the filter is unity. Plot the resulting magnitude response. On the same graph, plot the 7 Problem 7 response of a fourth order Butterworth filter. Which of the filters has a better stop band response ? Can A linear time invariant filter has an impulse response h(t). The input to the filter, x(t) is constrained so as to you intuitively explain why ? never exceed 1 in absolute value - i.e |x(t)| ≤ 1. Determine the maximum value that y(t), the filter output, can ever attain, for arbitrary values of x(t) satisfying the F (ω 2 ) constraint above. What x(t) will drive the filter output to this maximum ? 1 0 ωo 1 ω Figure 4: F (ω 2 ) is maximally flat about ω = ωo . 2

