Resonant X-ray Reflectivity Study of Perovskite Oxide Superlattices
advertisement
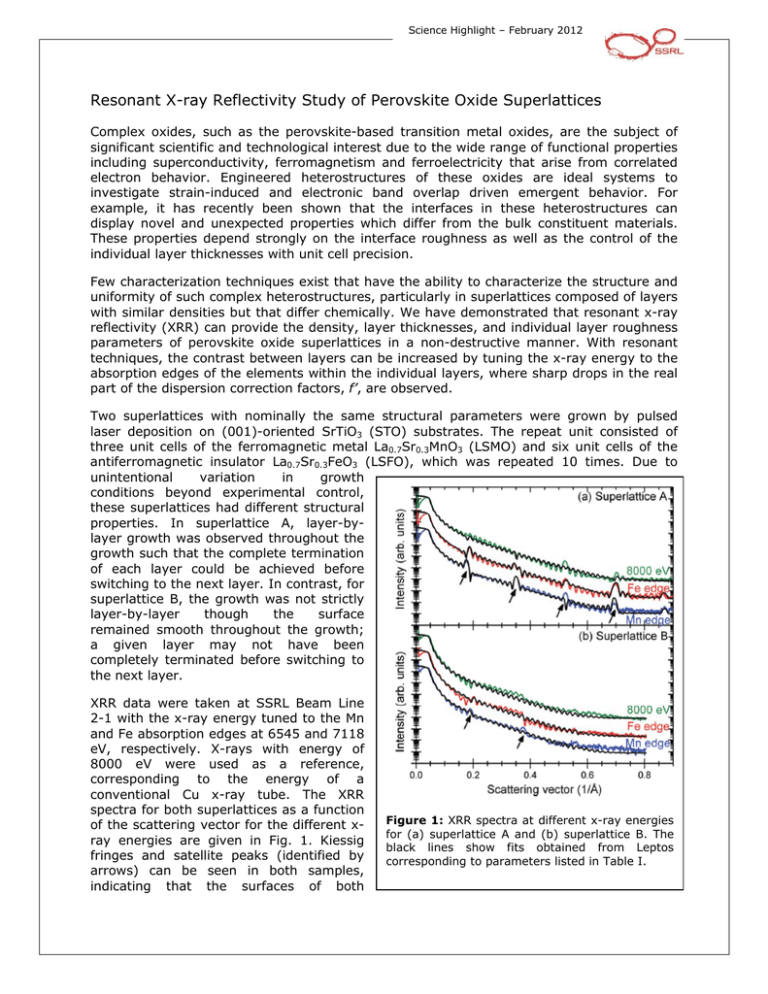
Science Highlight – February 2012 Resonant X-ray Reflectivity Study of Perovskite Oxide Superlattices Complex oxides, such as the perovskite-based transition metal oxides, are the subject of significant scientific and technological interest due to the wide range of functional properties including superconductivity, ferromagnetism and ferroelectricity that arise from correlated electron behavior. Engineered heterostructures of these oxides are ideal systems to investigate strain-induced and electronic band overlap driven emergent behavior. For example, it has recently been shown that the interfaces in these heterostructures can display novel and unexpected properties which differ from the bulk constituent materials. These properties depend strongly on the interface roughness as well as the control of the individual layer thicknesses with unit cell precision. Few characterization techniques exist that have the ability to characterize the structure and uniformity of such complex heterostructures, particularly in superlattices composed of layers with similar densities but that differ chemically. We have demonstrated that resonant x-ray reflectivity (XRR) can provide the density, layer thicknesses, and individual layer roughness parameters of perovskite oxide superlattices in a non-destructive manner. With resonant techniques, the contrast between layers can be increased by tuning the x-ray energy to the absorption edges of the elements within the individual layers, where sharp drops in the real part of the dispersion correction factors, f’, are observed. Two superlattices with nominally the same structural parameters were grown by pulsed laser deposition on (001)-oriented SrTiO3 (STO) substrates. The repeat unit consisted of three unit cells of the ferromagnetic metal La0.7Sr0.3MnO3 (LSMO) and six unit cells of the antiferromagnetic insulator La0.7Sr0.3FeO3 (LSFO), which was repeated 10 times. Due to unintentional variation in growth conditions beyond experimental control, these superlattices had different structural properties. In superlattice A, layer-bylayer growth was observed throughout the growth such that the complete termination of each layer could be achieved before switching to the next layer. In contrast, for superlattice B, the growth was not strictly layer-by-layer though the surface remained smooth throughout the growth; a given layer may not have been completely terminated before switching to the next layer. XRR data were taken at SSRL Beam Line 2-1 with the x-ray energy tuned to the Mn and Fe absorption edges at 6545 and 7118 eV, respectively. X-rays with energy of 8000 eV were used as a reference, corresponding to the energy of a conventional Cu x-ray tube. The XRR spectra for both superlattices as a function of the scattering vector for the different xray energies are given in Fig. 1. Kiessig fringes and satellite peaks (identified by arrows) can be seen in both samples, indicating that the surfaces of both Figure 1: XRR spectra at different x-ray energies for (a) superlattice A and (b) superlattice B. The black lines show fits obtained from Leptos corresponding to parameters listed in Table I. superlattices are extremely smooth. Superlattice A shows more uniformly spaced satellite peaks, whereas in superlattice B these satellite peaks are more diffuse and disappear after the second peak. In both cases, the satellite peaks appear more prominently at the absorption edges than at 8000 eV. The total film thickness is related to the spacing of the Kiessig fringes, while the spacing of the satellite peaks corresponds to the thickness of the repeat unit of the superlattice. Fitting of the XRR spectra was performed using simulated annealing and genetic algorithms implemented in Leptos software from Bruker AXS. Interface roughness was modeled using the Nevot-Croce model which approximates the real interface profile as an error function. The density, roughness and thickness values from the best fits (black lines in Fig. 1) are listed in Table I. The density values were assumed to be the same in both superlattices and were obtained from the best fits for superlattice A. The cost function, a measure of agreement between the experimental data and simulation, is calculated using a logarithmic function and is listed in Table I for each fit. Figs. 3(a) and 3(c) plot depth profiles of the superlattices based on these XRR fits. These fits reveal that the main difference between the superlattices is an order of magnitude increase in the roughness for superlattice B. Due to the large roughness, the Fe (Mn) concentration does not reach its full value within the LSFO (LSMO) layers and it does not drop to zero within the LSMO (LSFO) layers. While fitting XRR spectra, different sample models may yield similar reflectivity curves with equal cost function. Therefore, Fe and Mn electron energy loss spectroscopy (EELS) line scans were acquired in a scanning transmission electron microscope (STEM) to verify the local concentration profiles of the superlattices (Fig. 2(b) and 2(d)). These line scans show that superlattice A has a uniform layer thickness throughout the superlattice with sharp interfaces and uniform Fe and Mn concentration. On the other hand, superlattice B has a larger variation in the thickness of the individual layers and graded interface profiles compared to superlattice A. The Fe signal drops to 40-50% within the LSMO layer while the Mn signal drops to 10% within the LSFO layer. STEM Z-contrast images confirm the number of unit cells in the superlattice to within one unit cell of the value determined by XRR. The XRR fitting provides quantitative values for the interface profiles and a rational for the nonzero Fe concentration within the LSMO layer. The chemical intermixing at the interfaces and irregular layer thicknesses can both contribute to the loss of the satellite peaks in the XRR spectra for superlattice B. We have demonstrated that resonant XRR can be used to characterize the structure and uniformity of complex superlattice structures. In particular, this technique has the advantage of being non-destructive and has the capability to distinguish between layers with similar densities but differ chemically. Figure 2: (a) and (c) XRR model and (b) and (d) Fe and Mn EELS line scans for superlattices A and B. EELS integration windows are Mn (640-658 eV) and Fe (707-728 eV), distance is measured from the film/substrate interface, and intensity values are normalized to the maximum value for individual line scans. The work at UC Davis was supported by the National Science Foundation (DMR 0747896) and UC Laboratory Fees Research Grant. National Center for Electron Microscopy (Contract No. DE-AC-2-05CH11231) and Center for Nanophase Materials Sciences are supported by the Office of Science, Office of Basic Energy Sciences of the U.S. Department of Energy. SSRL, a Directorate of SLAC National Accelerator Laboratory and an Office of Science User Facility, is operated for the U.S. Department of Energy Office of Science by Stanford University. Primary Citation N. Kemik, M. Gu, F. Yang, C.-Y. Chang, Y. Song, M. Bibee, A. Mehta, M.D. Biegalski, H.M. Christen, N.D. Browning, and Y. Takamura, Resonant X-ray Reflectivity Study of Perovskite Oxide Superlattices Appl. Phys. Lett., 99, 201908 (2011) Contact Apurva Mehta, mehta@slac.stanford.edu SSRL is primarily supported by the DOE Offices of Basic Energy Sciences and Biological and Environmental Research, with additional support from the National Institutes of Health, National Center for Research Resources, Biomedical Technology Program, and the National Institute of General Medical Sciences.
