1 Preliminary Reading 2 Equipment 3 Preliminary 4 The inverting
advertisement

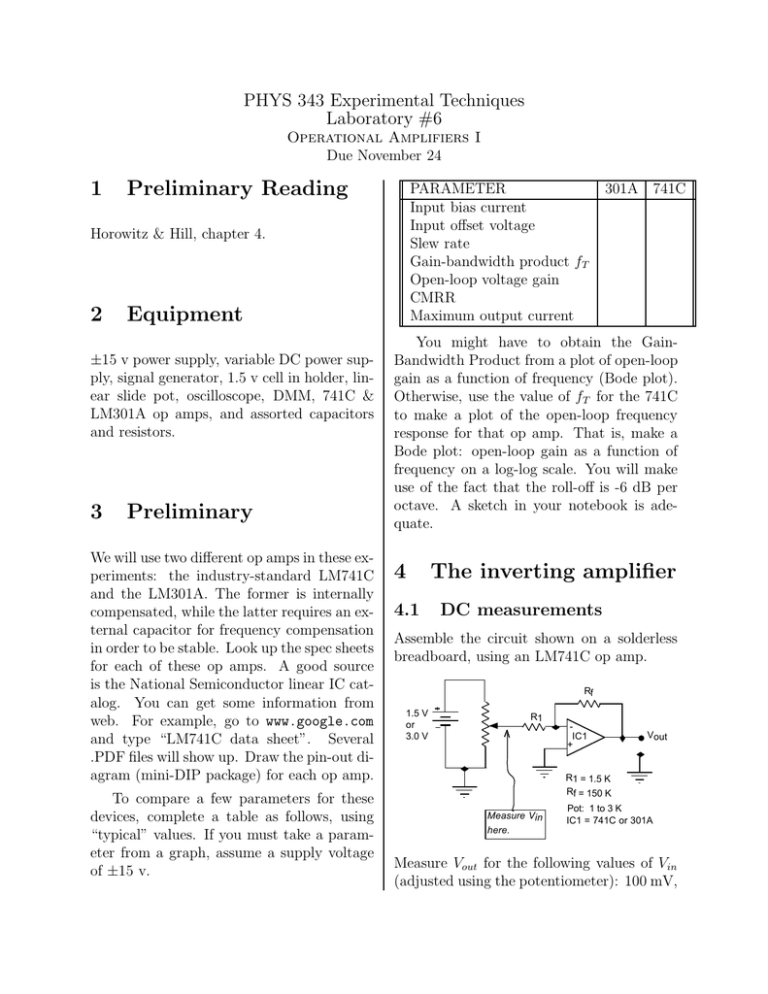
PHYS 343 Experimental Techniques Laboratory #6 Operational Amplifiers I Due November 24 1 Preliminary Reading PARAMETER Input bias current Input offset voltage Slew rate Gain-bandwidth product fT Open-loop voltage gain CMRR Maximum output current Horowitz & Hill, chapter 4. 2 Equipment ±15 v power supply, variable DC power supply, signal generator, 1.5 v cell in holder, linear slide pot, oscilloscope, DMM, 741C & LM301A op amps, and assorted capacitors and resistors. 3 Preliminary We will use two different op amps in these experiments: the industry-standard LM741C and the LM301A. The former is internally compensated, while the latter requires an external capacitor for frequency compensation in order to be stable. Look up the spec sheets for each of these op amps. A good source is the National Semiconductor linear IC catalog. You can get some information from web. For example, go to www.google.com and type “LM741C data sheet”. Several .PDF files will show up. Draw the pin-out diagram (mini-DIP package) for each op amp. To compare a few parameters for these devices, complete a table as follows, using “typical” values. If you must take a parameter from a graph, assume a supply voltage of ±15 v. 301A 741C You might have to obtain the GainBandwidth Product from a plot of open-loop gain as a function of frequency (Bode plot). Otherwise, use the value of fT for the 741C to make a plot of the open-loop frequency response for that op amp. That is, make a Bode plot: open-loop gain as a function of frequency on a log-log scale. You will make use of the fact that the roll-off is -6 dB per octave. A sketch in your notebook is adequate. 4 4.1 The inverting amplifier DC measurements Assemble the circuit shown on a solderless breadboard, using an LM741C op amp. Rf 1.5 V or 3.0 V R1 IC1 + Vout R1 = 1.5 K Rf = 150 K Measure Vin Pot: 1 to 3 K IC1 = 741C or 301A here. Measure Vout for the following values of Vin (adjusted using the potentiometer): 100 mV, 50 mV, 25 mV, 0 V, -25 mV, -50 mV, and -100 mV. (How do you get the negative voltages? You just change the ground connection on the battery!) You may include some other values if you wish. Make a graph of Vout as a function of Vin and determine the voltage gain by a linear regression best fit to the line. Compare experimental and theoretical values for the gain and explain any discrepancies. (Note: it would be a good idea to measure the resistor values with an ohmmeter, to get three significant figures.) Disconnect the slide wire and ground the input resistor R1 (so that Vin = 0). Measure the output voltage and compare it to your “0 v” reading above. How does this measurement relate to the input offset voltage, VOS , of the op amp? To accurately zero the output, we have to use a nulling circuit, covered in a later lab. 4.2 Frequency response Disconnect the potentiometer and use the signal generator to supply a 100 mV p-p sine wave to the amplifier input. Measure the voltage gain (magnitude) as a function of frequency, using frequencies of 100 Hz, 300 Hz, 1000 Hz, 3000 Hz, and so on, up to 2 MHz. Record your data in a table. Make a log-log plot of the magnitude of gain as a function of frequency. The easiest way is to use Excel and use the log-log graph option. From your earlier plot of open-loop frequency response (Bode plot) you should have been able to predict when a roll-off would begin. Compare the earlier plot with the actual data you have obtained. Now turn off the power supply and replace the 741C with a 301A op amp. Turn on the power supply. You should observe that the op amp is in oscillation; it is unstable without an external compensating capacitor. Hook a small capacitor between 5 and 50 pf (record the value) between pins 1 and 8. The oscillation should cease. Again measure gain as a function of frequency, as you did for the 741C. On the same graph you used before, plot the gain versus frequency. How does the performance of the two op amps compare? Replace the small capacitor with a larger value, 150 pf or some other available value. Take a few readings of the gain to determine the roll-off under these conditions and the new unity-gain frequency. (Take points up to at least 200 KHz.) Plot these points on the graph. What is the effect of a larger compensating capacitor? 5 Summing amplifier Assemble the circuit shown and measure the output voltage on the scope. Make a sketch of the waveform. Be sure the scope is DCcoupled. While observing the waveform, disconnect the signal generator. Hook it back up and disconnect the battery. Do you understand what is happening? Calculate what the output voltage should be and compare this with your measured (time-dependent) voltage. Don’t calculate some maximum and minimum values for Vout . Rather, find the average value (DC component) and the amplitude of the sine wave that is superimposed on this DC level. After all, that is really what is happening! Rf R1 1.0 V p-p, 100 Hz R2 + 1.5 V + Vout 741C R1 = R2 = 2.2 K Rf = 12 K To increase the precision of your calculations, you should (1) measure the battery voltage directly with the voltmeter and (2) measure the values of the individual resistors. What would the output voltage waveform look like if R1 were replaced with a value twice as large? Illustrate with a sketch. 6 Question The gain of an inverting amplifier is proportional to Rf /R1 (referring to the diagram of section 3) In the first circuit, would it work just as well to use values of R1 = 2.2 Ω and Rf = 220 Ω ? Explain. of time. For each circuit, plot Vout and V in on the same graph. Now, hook up the circuits and observe the results. Were your predictions correct? If not, what was the problem? (Note: don’t “fudge” your predictions. You will not be graded on whether you were right or wrong. I will be more impressed if you can give me a clear description of what your misconceptions (if any) were.) Zener diodes (especially low-voltage Zeners) often have a “soft” knee around the Zener voltage. Did the effects of this show up in your observations? If so, exactly what were the effects you observed? Vin 7 A final activity (review) Obtain two low-voltage Zener diodes; the Zener voltage should be less than 8 volts or so. Consider the circuits below. For each circuit, predict the output voltage Vout . Draw graphs in your notebook of V in (a triangle wave) and Vout as a function Vin 1K Vout Vout 1K Vin is a triangle wave with 10-volt amplitude.


