Adv. Space Res. Vol. 8. No. 4. pp. (4)201—(4)204. 1988
Printed in Great Britain. All rights reserved.
()2~’3—1177/88 $001) ± .51)
Copvrtght © COSPAR
LAY-FUNCTIONS FOR f2 PROFILES
L. Bossy,~R. R. Gamache” and B. W. Reinisch”
*Université Catholique de Louvain, B-1348 Louvain-la Neuve, Belgium
**University of Lowell CenterforAtmospheric Research, Lowell MA 01854,
U.S.A.
INTRODUCTION
Modern ionosondes /1/ calculate the vertical electron density profiles in real time providing a good data base for the global modeling of the ionospheric electron density distribution.
The Digisonde 256 outputs the profiles in form of coefficients for a polynomial representation /2/ for each of the layers.
When first publishing their results, Reinisch and
Huang /3/ mentioned the possibility of substituting LAY functions for the polynomial profile
presentations.
In this paper we study the fitting of LAY functions profiles obtained in real
time by Digisondes at Ar~entia, Newfoundland (
47aN, 54°W), Richfield, Utah (39°N, 112°W) and
Natal, Brazil (5.7°S, 65 W). We use the technique proposed in /4/ to determine the LAY parameters SC and MX.
Because of its efficiency this algorithm lends itself to real, time
processing.
FITTING OF LAY FUNCTIONS AND IMPLEMENTATION
The representation of the electron density profile of the F2 layer by a single LAY function is discussed.
The LAY function used for this purpose has described in Reference 4.
The
advantage of the LAY function fit of the profile is that in general the entire F2 profile is
well represented by one LAY function, defined by only four parameters foF2 (critical frequency), Hmax (pe~ height), MX (height parameter) and sc (scale parameter) /4/.
Other
methods like the ULCAR Chebyshev polynomial representation requires five coefficients plus
the beginning and ending frequency of the layer.
Titheridge’s POLAN true height analysis
program /5/, in its preferred mode (6), uses six coefficients per point plus the starting
frequency and height; in the POLAN polynomial mode used in the Digisonde (a 4th order poiynomial), 11 parameters are needed to represent the F2 profile.
LAY function fitting was performed for some three thousand electron density height profiles which were calculated from ionograms with the POLAN method using a fourth order poiynomial expansion of the F2 profile.
The form of the LAY function always assures a good fit
at the layer peak, but it must be checked how far down in frequency the fit is acceptable.
We defined error thresholds of 3 km, 5 km and 10 km to determine the lower frequency limit of
the fit. The 3 km threshold resulted in too narrow frequency intervals for which the fit is
acceptable, and 10 km appears too coarse a measure. With a 5 km error, the LAY functions can
describe almost the entire F2 region, so we decided to select the 5 km threshold for further
analysis.
Our LAY analysis program computes and records the average absolute error per point in
km, together with the number of frequency points and the threshold frequency fminLAY.
The
values of foE, foFl (when present), foF2, and the inflection point of the F2 profile are
saved to study the range of the LAY fits.
From the parameters, the ratios HX/HmaX and (Hmax~
HX)/SC are calculated and stored.
Since the profiles are available, we also calculate the
factor G from H(0.5) — G Hmax, where H(O.5) is the height where the electron density is N =
0.5 Nmax F2~ The G factors found for the profiles are compared with the value G = 0.8 suggested by Gulyaeva /6/.
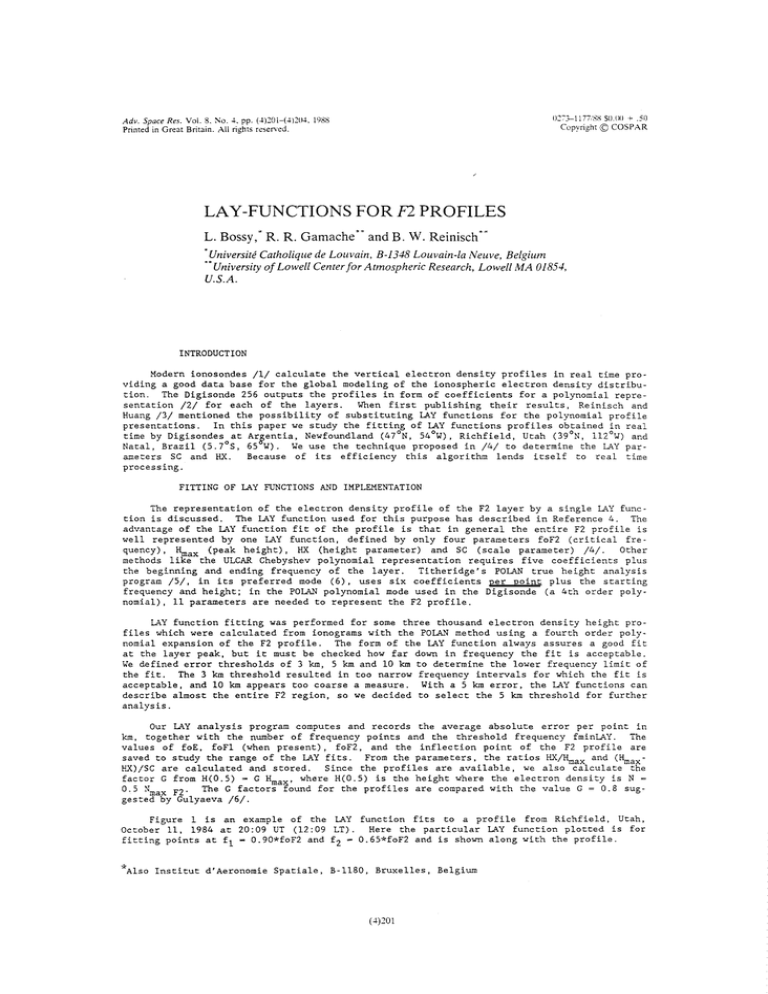
Figure 1 is an example of the LAY function fits to a profile from Richfield, Utah,
October 11, 1984 at 20:09 UT (12:09 LT).
Here the particular LAY function plotted is for
fitting points at f1 — 0.90*foF2 and f2
0.65*foF2 and is shown along with the profile.
5Also Institut d’Aeronomie Spatiale, B-ll8O,
Bruxelles, Belgium
(4)201
(4)202
L. Bossy et at.
Richfield, Utah
Oct. 11, 1984
:
profile: solid line
LAY function: symbols
250-
1
/
*
*
*
*
‘~‘230I
—~
(fl.zl)
I
(f2z2)
*
ii
1190’-
lnflectiotll
point
I
1 70’—
4.0
I
I
5.0
I
I
I
I
6.0
I
I
7.0
Frequency (MHz)
I
I
I
I
I
I
I
8.0
Figure 1.
Fitting LAY function profile.
The three selected points were (8.3 MHz,
285 km), (7.5 MHz, 224 km), and (5.4 MHz, 200 km).
The LAY function approximates
the F2 profile to frequencies well below the inflection point.
foFl for this
ionogram is 4.3 MHz.
This fit has an average absolute error per point of 1.08 km with a 5 km maximum error, and
agrees with the profile.
The LAY parameters for this F2 profile are MX
197 km and SC =
20.5 km.
DOMAIN OF VALIDITY OF THE FIT
Our studies show that most of the time the LAY functions, with 5 km maximum error, represent the entire F2 layer down to f
foE or foFl during the day, and to the first scaled
ionogram frequency during the night.
The solid lines in Figure 2 represent the median values
for Argentia, Richfield and Natal of the ratio fminlAY/foF2.
For Argentia, we analyzed profile data for February/March, May/June and October/November 1986 (the upper three curves in
Figure 2). The dashed lines represent the ratios foFl/foF2 during daytime when the Fl layer
exists.
The Argentia data show fminLAY to be within 5% of foFl, i.e. not more than about 200
kHz above foFl.
Without an Fl layer, fminLAY reaches down to the lower F region.
The horizontal lines at 70.7% for the Argentia curves indicate the level where the electron density N
is half the maximum density of the layer.
DIURNAL VARIATIONS OF LAY PARAMETERS
For modeling purposes, it is desirable that the LAY parameters do not vary too rapidly
as a function of time, and that characteristic parameter values exist for each season and
time of day. Figure 3 shows the diurnal variations of the median values for R
HX/Hmax, expressed in percent.
For Argentia, the median R lies generally between 70 and 80%, except
during noontime in summer, when R dips down to 60%. The relatively large data set for
(4)203
F2 Profiles
:‘ °III’:~~.~::::::
~:
2080’
.,L—=...~
~ ,,jf
.!.
20~
-20
-80
-.
A~r26—June 27
foFl/foF2
-20
~
10’
I
18
I
3
6
9
12 15
Local time
90-
UQ
70
~
=~—_~_.-~
~ 70-
Note). Brazil
-30
I
21
I
,70
-
90-
-90
Aug.27—Septl2
—10
24
1982
70—
0
I
3
I I
6
I
9
12 15
Local time
I
I
18
21
—70
24
I
Figure 3. Diurnal variation of Median for 0—OXfOonx.
The upper and lower quartilan (hg cod Id) indicate
n 10% opreud in 05/urea.
50-
-50
90-
.
ArQerltlo. NE
Feb 12—kr 2
‘.
_____________________________
30
-SO
“/‘\,~_,‘
90
Figura 2. Diurnal variation of cedian fI.intaYftaF2
THe dasHed urea 01,0,, the region fnFl/feF2,indiCatioq
that fointhia
geeerally within 200 000 of foCi.
uo
70
50-
Oct.13—Nov. 7
-50
-90
‘s,
~IIII~:~IIIII!~
~!!
~
30’
0
.40
\~..............
~
1966
:~:~
~
~40
so-
1966
30
,
-~
-
~
-90
~
I
70
70
LQ
1050-
--‘LO
--
uo,’ ‘—-~
,‘\
10-
LO
Argentio. NE
Apr 26—June 27
“
‘--
-io
1986
.
,~‘\,‘
~_~‘
‘.
~
M’~/,’t~4,-~
1050-
1050-
-10
-50
L
l..j
30
ill
6
1(1
9
-50
90
70
70
~
1986
(I
.
~i~i
~
-30
12 15 18 21 24
Local time
Figure 4. Diurnal variation cC ediao, SC.
The median SC values for th, aid latitada etotinnn
lie Hetween 25 Ia ole a.
.
Richfield. Utah
Oct.ll=Oct,14
-30
‘1
3
70
U0
I
.
Ia
-
50-
=
Oct.13—Nov. 7
-10
-50
,t\~,..,..
10—
~
70
‘——::
-~N..,-----’--
-‘LQ’~~
30-
0
30
‘~‘
-go
——
Arg ent~a NE
Uo
,~30-
-50
90
30
~
150.
1986
-50
~‘
30
In
-10
-
““
-
9070-
—
-
._,...—.
,._..“\
—t.--—~
—
vy
so-
1984
.
Natal. Brazil
Au9.27—Septl2
90
/~~
, __________________________
70lull
0
70
-so
90-
1982
-50
-90
3
~
6
9
-70
—so
12 15 18 21 24
Local time
Figure 5. Diurnal variation of aedian S Cantor.
His close to 05% unless tori 0 0,707fl~.
(4)204
L. Bossy et a!.
Argentia allowed to determine the spread in R by calculating the upper and lower quartiles,
marked UQ and LQ respectively.
It is interesting to see, that for periods of small diurnal
variations the data spread is also small.
The relatively large R variations for Richfield are possibly the result of the small
data sample (only four days).
For the equatorial station Natal, the available median R
values all lie between 75 and 85%.
The median scale heights SC are generally confined to values between 25 km ±10 km, at
least for Argentia and Richfield.
The spread in SC values for Argentia, as indicated by the
upper and lower quartiles, is at times considerable making it difficult to select a suitable
SC for modeling purposes.
The equatorial data for 1982 (high sunspot number) show a very
different behavior, at least during the three hour period from 1630 to 1930 LT.
SC decreases
rapidly from 60 to 25 km.
It would be necessary to study a larger equatorial data set to
test the diurnal variation of SC at the equator.
Since all the data were available in the computer, we also calculated the Gulyaeva C
factor /6/.
The median values for the three stations discussed for the LAY fittings are
shown in Figure 5.
For fall, the C-value is close to 80% on all three stations.
However,
substantial deviations exist in early spring and sunhxuer at Argentia, when during daytime the
median value dips below 60%. Of course, this is the effect of the Fl layer.
In summer foFl
is consistently larger than 0.707 foF2, i.e. N(foFl) > 0.5 Nmax, during the day (Figure 2),
and the F2 layer shape factor C is ill defined.
CONCLUS IONS
The F2 layer profiles can be expressed in terms of LAY functions with parameters HX/Hmax
and SC that have a fairly small diurnal variation in their median values.
Our studies could
be expanded to express the entire E-Fl-F2 profile as a linear combination of LAY functions,
and investigate whether the LAY parameters HX/Hmax and SC still maintain a systematic
behavior.
REFERENCES
1.
B. W. Reinisch, New Techniques
Sd. 21, #3, 331-341 (1986).
in Ground-Based
Ionospheric Sounding and Studies, ~
2.
B. W. Reinisch, R. R. Gamache, X. Huang and L. F.
Profiles from Ionograms, This Issue (1987).
3.
B. W. Reinisch and Huang Xueqin, Automatic Calculation of Electron Density Profiles from
Digital Ionograms.
3. Processing of Bottomside lonograma, Radio Sci. 18, #3, 477-492
(1983).
4.
L. Bossy, The Determination of LAY-Parameters for a Given Profile,
Vol. 7, No. 6, p. 35 (1987).
5.
J. E. Titheridge, lonogram Analysis with the Generalized Program POLAN,
World Data Center A (S.T.P.), Boulder, CO (1985).
6.
T. L. Gulyaeva, Implementation of a New Characteristics Parameter into the IRI Sub-Peak
Electron Density Profile, Adv. Space Rag., 2, No. 10, 191-194 (1983).
McNamara, Real Time Electron Density
Adv.
in Space
Rept.
Rca.
UAC-93,
ACKNOWLEDGEMENT
The work of the University of Lowell authors was in part
Geophysics Loboratory, Hanscom Air Force Base, Massachusetts.
supported by the
Air Force

