)
in
in
Mrayl
dB/m
SLG Map
Map
–150
us
150
Echo from
8½-in
borehole wall
Echo from
7-in casing
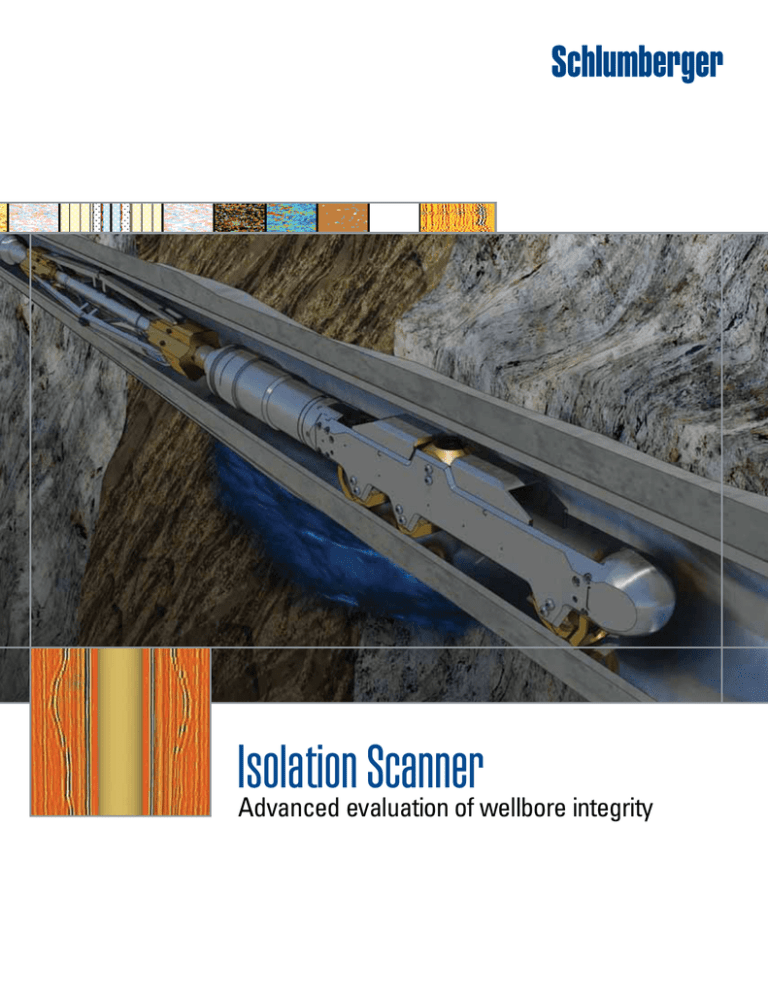
Isolation
Scanner
Advanced evaluation of wellbore integrity
Isolation Scanner* cement evaluation service integrates the conventional
pulse-echo technique with flexural wave propagation to fully characterize
the cased hole annular environment while evaluating casing condition.
Applications
Differentiate highperformance lightweight
cements from liquids
■
Map annulus material as
solid, liquid, or gas
■
Assess hydraulic isolation
■
Identify channels and defects
in annular isolating material
■
Determine casing internal
diameter and thickness
■
Assess annulus beyond the
casing/cement interface
■
C
ement placement is a critical component of a well’s architecture
for ensuring mechanical support of the casing, providing protection
from fluid corrosion, and, most importantly, isolating permeable zones
with different pressure regimes to prevent hydraulic communication.
Conventional cement bond log (CBL) and ultrasonic pulse-echo techniques are sometimes used together to diagnose zonal isolation but
encounter difficulties when attempting to evaluate cements with low
acoustic impedance or cements contaminated with mud. Ambiguity can
result because these tools rely on a significant contrast in acoustic
impedance between the cement and displaced fluid to identify solids.
Isolation Scanner cement evaluation service provides more certainty by
combining the pulse-echo technique with a new ultrasonic technique that
induces a flexural wave in the casing with a transmitter and measures the
resulting signals at two receivers. The attenuation calculated between the
two receivers provides an independent response that is paired with the
pulse-echo measurement and compared with a laboratory-measured
database to produce an image of the material immediately behind the
casing. By measuring radially beyond traditional cement evaluation boundaries,
Isolation Scanner service confirms zonal isolation, pinpoints any channels in
the cement, and ensures confident squeeze or no-squeeze decisions.
The signals following the casing arrivals arising from the interface
between the annulus and the borehole or outer casing can be detected
and measured. These third-interface echoes (TIEs) provide the position
f the casing within the borehole, and if the borehole size is known, the
velocity of the annulus material can be determined. This additional
information, available only through the flexural measurements, can
provide useful information for remedial applications and serve to confirm
or determine the correct interpretation for complex evaluations.
8
6
Gas
Liquid
Cement
Contaminated cement
Acoustic impedance, 4
Mrayl
Difficult to diagnose with
acoustic impedance or
CBL measurements alone
2
Isolation Scanner cement evaluation
service fully characterizes the cased
hole environment, including casing
position in the borehole, borehole and
outer string imaging, and material
identification from velocity analysis.
Neat
Increasing
contamination
Light
0
Identifying and distinguishing various well fluids from cement with low acoustic
impedance is difficult for CBL and ultrasonic pulse-echo techniques.
x250
R
Flexural wave imaging
Pulse-echo tool
x300
Annulus
Formation
Pulse
echo
Pitch-catch propagation
The Isolation Scanner pulse-echo acoustic impedance measurement
is made with a rotating subassembly containing four transducers.
The normal-incidence transducer is oriented 180° from the other
three transducers. The three obliquely aligned transducers transmit
and receive high-frequency pulsed beams (on the order of 250 kHz)
to excite the casing in a flexural mode. Once excited in the casing,
the flexural wave propagates while radiating acoustic energy into
the annulus and back toward the receiving transducers, resulting
in a circumferential scan of the casing, annulus, cement, and nearwellbore formation. The annulus-propagating energy is reflected at
interfaces that present an acoustic contrast, such as the cement/
formation interface, and propagates back through the casing predominantly as a flexural wave that reradiates energy into the casing fluid.
The Isolation Scanner sub implements the
pulse-echo (normal-incidence) technique
with four transducers: a transreceiver and
the flexural wave imager comprising one
transmitter and two receivers obliquely
aligned to excite the casing flexural mode.
Flexural wave (TIE)
Flexural wave (casing arrival)
Ultrasonic wave
Borehole
T
x350
Casing
80 90 100 110 120 130 140 150 160 170
Time, us
Geometrical interpretation of signal propagation for the pulse-echo
(blue paths) and flexural wave imaging (green paths) techniques shows
that the pitch-catch flexural wave signal separates into an early-arriving
(or casing) signal and a later-arriving (TIE) signal in reference to the first
interface encountered in the annulus (the inner and outer walls of the casing
are the first and second interfaces, respectively). The attenuation of the
casing arrival amplitude complements the pulse-echo measurement to
determine whether the material behind the casing is a fluid or a solid. If
TIEs are present in the acquired data, they are used to further enhance
the characterization of the cased hole environment in terms of the state and
acoustic properties (wave speed) of the material filling the annulus, the position of the casing within the hole, and the geometrical shape of the hole.
Insight through attenuation
Solid-liquid-gas mapping
The rate of energy radiation into the annulus depends on the acoustic
properties of the annular fill. The attenuation is estimated by capturing the reflected signals at two of the receivers, which are a known
distance apart, and calculating the decay rate of the received signal.
Attenuation is expressed in decibels per centimeter.
The first goal of Isolation Scanner processing is to provide a robust
interpreted image of the material immediately behind the casing. The
inputs are cement impedance determined by the pulse-echo measurement and flexural wave attenuation computed from the amplitude of
the casing arrivals on the near and far receivers. These two independent
measurements are linked to the properties of both the fluid inside
the casing and the outside medium through an invertible relation.
Combining them accounts for the effect of the inside fluid, which
eliminates the need for logging specific fluid-property measurements.
For a fluid filling the annulus, the attenuation is approximately proportional to the acoustic impedance. For cement bonded to the casing, the
attenuation exhibits a more complex behavior as a function of the
velocities at which the compressional and shear waves propagate in
the cement. As shown in the plot of flexural attenuation versus acoustic
impedance for a well-bonded cement, below a critical impedance (Zc)
of approximately 3.9 Mrayl, the attenuation increases linearly with the
impedance of the annular fill, whether the fill is liquid or solid. Beyond
3.9-Mrayl Zc, only the shear waves can propagate in the cement, and
the attenuation drops sharply to small values. A high-impedance cement,
such as Class G, has an attenuation similar to that of a liquid. This
ambiguity in identifying cement is resolved by determining the acoustic
impedance of the cement with the pulse-echo technique. However, the
distinct attenuation of low-impedance cements, such as lightweight or
contaminated cements, is used to differentiate them from fluids.
1
Solid
Liquid
Water
Gas
0.9
0.8
The processing output is a solid-liquid-gas (SLG) map displaying the
most likely material behind the casing. The map is computed during
an initialization step before logging by using a priori knowledge of the
possible materials:
■
■
■
■
Gas is defined as a very low impedance material, independent of
any input.
Liquid is defined as a liquid with the expected acoustic impedance
of the mud displaced by the cement, with provisions for possible
deviations from this value.
Solid is defined through the expected type of cement. A laboratorymeasured database is used to convert the material selection into
acoustic properties, again with provisions made for some contamination or incompletely set cement.
Areas corresponding to inconsistencies between the measurements (for example, at collars) are shown in white.
The mapped states are obtained for each azimuth by locating the
pulse-echo and flexural attenuation measurements, corrected for the
effect of the inside fluid, on the map with the areas encompassed by
each state.
0.7
0.6
Flexural attenuation,
0.5
dB/cm
0.4
1.8
0.3
1.6
1.4
0.2
1.2
Zc
0.1
0
Gas
Liquid
Solid
0
1
2
3
4
5
Acoustic impedance, Mrayl
Flexural wave attenuation of a well-bonded cement is plotted as a function
of acoustic impedance for various materials. The value of Zc corresponds to
the critical compressional wave speed of the cement.
6
1
Attenuation,
0.8
dB/cm
0.6
0.4
Nominal uncontaminated
Class G cement
0.2
0
–0.2
-2
0
2
4
6
Zusit, Mrayl
8
Three clouds of points are generated in SLG mapping of the measurement
plane for a Class G cement. Zusit is the impedance determined by the pulseecho technique; the attenuation is for the flexural wave technique.
10
x300
By measuring radially and beyond traditional cement evaluation boundaries,
Isolation Scanner service confirms zonal isolation, pinpoints any channels
in the cement, and ensures confident squeeze or no-squeeze decisions.
x350
Casing
Collar
Locator
–10
30
Depth, m
–500.0000
–6.0000
–5.6000
–5.2000
–4.8000
–4.4000
–3.6000
–3.2000
–2.6000
–2.4000
–2.0000
–1.6000
–1.2000
–0.6000
–0.4000
0.5000
–500.0000
–0.0780
–0.0680
–0.0520
–0.0440
–0.0380
–0.0280
–0.0200
–0.0120
–0.0040
0.0120
0.0280
0.0360
0.0440
0.0520
0.0600
0.0880
0.0760
Maximum
Internal
Radius
4.5 in
3.0 3.0 in
External
Radius
Average
(ERAV)
4.5 in
4.5
External
Radius
Average
(ERAV)
3.0 3.0 in
Minimum
Internal
Radius
Amplitude
Internal
of Echo
Radii Minus
Minus Max. Average, 4.5 in
(Rugosity)
in
Minimum
Internal
Radius
4.5
Maximum
Internal
Radius
3.0 3.0 in
–500.0000
–0.0780
–0.0680
–0.0520
–0.0440
–0.0380
–0.0280
–0.0200
–0.0120
–0.0040
0.0040
0.0120
0.0200
0.0280
0.0360
0.0440
0.0520
0.0600
0.0680
0.0760
–500.0000
–0.03000
2.8000
2.9091
3.0182
3.1273
3.2364
3.3454
3.5638
3.6727
3.7818
3.8909
4.0000
0.0000
50.0000
57.0000
64.0000
71.0000
78.0000
85.0000
92.0000
99.0000
106.0000
113.0000
120.0000
127.0000
134.0000
141.0000
155.0000
Thickness
Flexural
Minus
4.5 Average, Impedance, Attenuation,
dB/m
Mrayl
in
Solid
Liquid
Gas
Seal
No seal
0º
SLG Map
Hydraulic
Communication
Map
Min.
VDL of Far Re
–150
x200
Echo from
8½-in
borehole wall
x250
x300
x350
In additional to pulse-echo information on the rugosity, radius, cross section, and thickness of the 7-in [17.8-cm] casing, Isolation Scanner service processed the
acoustic impedance and flexural attenuation data to produce an SLG map. Although the cement is heavy Class G, the flexural attenuation map clearly displays
low-density material from X,320 to X,270 m, revealing that the cement is contaminated in that interval. Regardless of the density difference, the material is correctly
indicated as solid on the SLG map.
New measurements from formation-wall echoes
In addition to the SLG map identifying the annular fill immediately
behind the casing, a further Isolation Scanner objective is to extract
relevant information from the annulus/formation reflection echo or
echoes for quantifying the state of the annulus between the casing
and formation. First, the echoes following the casing arrival are detected
and their time of arrival and amplitude measured. From the time differences between the reflection echoes and the casing arrival—provided
sufficient echo azimuthal presence is available in the data—the casing
centering within the borehole can be determined. This is conveniently
presented as a percentage, with 100% representing perfect centering
and 0% for fully eccentered casing, in contact with the formation wall.
If the borehole diameter is known, the time-difference processing can
be further converted into material wave velocity and is displayed as
an annulus velocity map.
Other new measurements possible with the Isolation Scanner TIE
reflected from the cement/formation interface are
■
estimated wave velocity, which can be used to confirm the
SLG map and better understand cement placement
■
imaged borehole shape
■
imaged outer string to reveal corrosion and damage.
Hole enlargement
Depth, m
X,673
X,674
X,675
X,676
Casing
arrival
X,677
X,678
Echo from
formation
wall
Hole enlargement
X,679
X,680
X,681
X,682
X,683
X,684
Isolation Scanner imaging of the formation wall through casing and cement reveals
hole enlargement (caving) in the reflection echo from the cement/formation interface at
two opposite azimuths in the intervals X,673–X,675 m and X,679–X,682 m. The left-side
image, displaying the raw data at all azimuths, shows that the formation-wall echo is
present at nearly all azimuths. Echo moveout appears sinusoidal because of casing
eccentering. Each cycle represents a tool azimuthal scan.
x300
Measurement Specifications
x350
Isolation Scanner Tool
Output†Solid-liquid-gas
map of annulus material, hydraulic
communication map, acoustic impedance, flexural
attenuation, rugosity image, casing thickness image,
internal radius image
Max. logging speed
Standard resolution (6 in, 10° sampling): 823 m/h [2,700 ft/h]
High resolution (0.6 in, 5° sampling): 172 m/h
[563 ft/h]
Range of measurement
Min. casing thickness: 0.38 cm [0.15 in]
Max. casing thickness: 2.01 cm [0.79 in]
Vertical resolution
High resolution: 1.52 cm [0.6 in]
High speed: 15.24 cm [6 in]
‡
Range: 0 to 10 Mrayl
Acoustic impedance Resolution: 0.2 Mrayl
Accuracy: 0 to 3.3 Mrayl = ±0.5 Mrayl,
>3.3 Mrayl = ±15%
Flexural attenuation
Range: 0 to 2 dB/cm§
Resolution: 0.05 dB/cm§
Accuracy: 0.01 dB/cm§
Min. quantifiable channel width 30 mm [1.2 in]
Casing and annulus up to 7.62 cm [3 in]
Depth of investigation†
Mud type or weight limitation†† Conditions simulated before logging
Combinability
Bottom only, combinable with most wireline tools
Telemetry: fast transfer bus (FTB) or enhanced FTB (EFTB)
Special applications
H2S service
†Investigation
of annulus width depends on the presence of third-interface echoes. Analysis and processing
beyond cement evaluation can yield additional answers through additional outputs, including the Variable
Density log (VDL) of the annulus waveform and polar movies in AVI format.
‡Differentiation
of materials by acoustic impedance alone requires a minimum gap of 0.5 MRayl between
the fluid behind the casing and a solid.
§For
8-mm [0.3-in] casing thickness.
††Max.
mud weight depends on the mud formulation, sub used, and casing size and weight, which are
simulated before logging.
Mechanical Specifications
Isolation Scanner Tool
Max. temperature
177 degC [350 degF]
Pressure range 1 to 138 MPa [145 to 20,000 psi]
Casing size—min.†4 1⁄2 in (min. pass-through restriction: 4 in)
Casing size—max.†9 5⁄8 in
Outside diameter
IBCS-A: 8.57 cm [3.375 in]
IBCS-B: 11.36 cm [4.472 in]
IBCS-C: 16.91 cm [6.657 in]
Length without sub
6.01 m [19.73 ft]
Weight without sub
151 kg [333 lbm]
Sub length, weight
IBCS-A: 61.22 cm [24.10 in], 7.59 kg [16.75 lbm]
IBCS-B: 60.32 cm [23.75 in], 9.36 kg [20.64 lbm]
IBCS-C: 60.32 cm [23.75 in], 10.73 kg [23.66 lbm]
10,000 N [2,250 lbf]
Sub max. tension
Sub max. compression
50,000 N [12,250 lbf]
†Limits
for casing size depend on the sub used. Data can be acquired in casing larger than 9 5⁄8 in with
low-attenuation mud (e.g., water, brine).
–3.2000
–2.6000
–2.4000
–2.0000
–1.6000
–1.2000
–0.6000
–0.4000
0.5000
–0.0280
–0.0200
–0.0120
–0.0040
0.0120
0.0280
0.0360
0.0440
0.0520
0.0600
0.0880
0.0760
4.5 in 3.0 3.0 in 4.5
External
Radius
Average
(ERAV)
External
Radius
Average
(ERAV)
Isolation Scanner
4.5 in 3.0 3.0 in 4.5
–0.0200
–0.0120
–0.0040
0.0040
0.0120
0.0200
0.0280
0.0360
0.0440
0.0520
0.0600
0.0680
0.0760
3.3454
3.5638
3.6727
3.7818
3.8909
4.0000
92.0000
99.0000
106.0000
113.0000
120.0000
127.0000
134.0000
141.0000
155.0000
Minimum Maximum
Internal
Internal
mplitude Internal
Radius
Radius Thickness
Flexural
of Echo Radii Minus
Minus
inus Max. Average, 4.5 in 3.0 3.0 in 4.5 Average, Impedance, Attenuation,
dB/m
Rugosity)
Mrayl
in
SLG Map
in
Depth, m
0º
•
7-in
casing
180º
x200
8½-in
borehole
x250
Min.
Amplitude
Max.
Hydraulic
x300
Communication VDL of Far Receiver at Two Opposing Azimuths,
Map
us
–150
150
x350
Echo from
8½-in
borehole wall
Echo from
7-in casing
www.slb.com/scanner
*Mark of Schlumberger
Copyright © 2011 Schlumberger. All rights reserved. 11-PR-0028
(Rugosity)

