Wireless Analog Input Sensor Nodes
advertisement

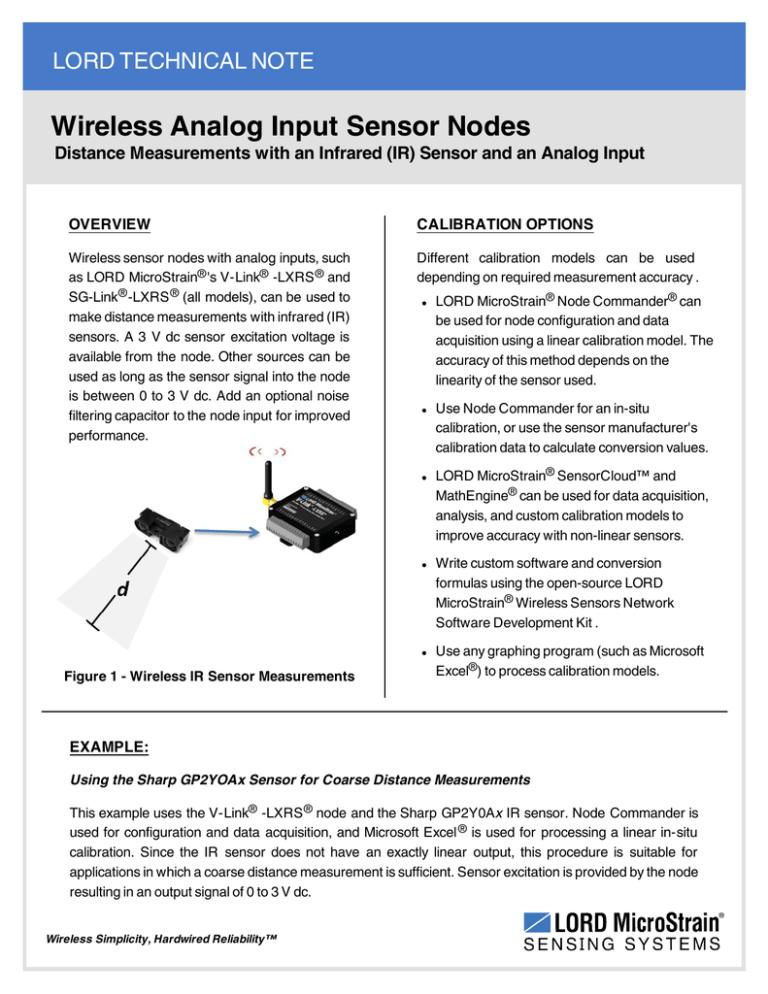
LORD TECHNICAL NOTE Wireless Analog Input Sensor Nodes Distance Measurements with an Infrared (IR) Sensor and an Analog Input OVERVIEW CALIBRATION OPTIONS Wireless sensor nodes with analog inputs, such as LORD MicroStrain® 's V-Link® -LXRS ® and SG-Link ® -LXRS ® (all models), can be used to make distance measurements with infrared (IR) sensors. A 3 V dc sensor excitation voltage is available from the node. Other sources can be used as long as the sensor signal into the node is between 0 to 3 V dc. Add an optional noise filtering capacitor to the node input for improved performance. Different calibration models can be used depending on required measurement accuracy . l l l l l Figure 1 - Wireless IR Sensor Measurements LORD MicroStrain® Node Commander® can be used for node configuration and data acquisition using a linear calibration model. The accuracy of this method depends on the linearity of the sensor used. Use Node Commander for an in-situ calibration, or use the sensor manufacturer's calibration data to calculate conversion values. LORD MicroStrain® SensorCloud™ and MathEngine® can be used for data acquisition, analysis, and custom calibration models to improve accuracy with non-linear sensors. Write custom software and conversion formulas using the open-source LORD MicroStrain® Wireless Sensors Network Software Development Kit . Use any graphing program (such as Microsoft Excel®) to process calibration models. EXAMPLE: Using the Sharp GP2YOAx Sensor for Coarse Distance Measurements This example uses the V-Link® -LXRS ® node and the Sharp GP2Y0Ax IR sensor. Node Commander is used for configuration and data acquisition, and Microsoft Excel ® is used for processing a linear in-situ calibration. Since the IR sensor does not have an exactly linear output, this procedure is suitable for applications in which a coarse distance measurement is sufficient. Sensor excitation is provided by the node resulting in an output signal of 0 to 3 V dc. Wireless Simplicity, Hardwired Reliability™ Distance Measurements with an Infrared (IR) Sensor and an Analog Input Technical Note 1. Connect the Sensor 1. Connect the Sharp GP2Y0A x sensor to a single- ended analog input, as shown in the diagram below. 2. Install a 220 uF filtering capacitor across the analog input to reduce signal noise (optional). Figure 2 - Example IR Sensor Connections 2. Collect Calibration Data 1. Establish communication with the node using Node Commander. 2. Open the configuration menu for the sensor's channel. 3. Configure the channel to measure the A/D Value in bits. Figure 3 - Channel Configuration Menu 2 Distance Measurements with an Infrared (IR) Sensor and an Analog Input Technical Note 4. Exit the channel configuration menu. 5. Set the node low duty cycle sampling to 32 Hz or higher. To conserve power, lower sample rates automatically turn off the sensor excitation between samples, which does not provide and adequate warm-up time for this sensor. Figure 4 - Low Duty Cycle Sampling 6. Start low duty cycle node sampling, and observe the A/D output readings. 7. Set the sensor at several different distances through the sensing range, and record the A/D value output reading. Any units for distance can be used. Figure 5 - Start Sampling 3 Distance Measurements with an Infrared (IR) Sensor and an Analog Input Technical Note 3. Calculate the Conversion Values A data analysis tool such as Microsoft Excel can be used determine the slope of a linear relationship between sensor output A/D value (bits) and engineering units. Here is an example, using Excel: 1. Open a blank spreadsheet. 2. Enter the A/D value (bits) measurements and engineering units in two columns. Enter A/D value in the left column (x-axis value) and the measured units in the right (y-axis value). 3. From the Insert menu, select Chart > Scatter. Select the preferred format. Figure 6 - Generate a Scatter Chart 4. Right-click on the graphed line, and select Add Trendline (see Slope and Offset Values on page 5). 5. Designate the line as Linear, and check the option to Display the Equation on the chart. 6. The formula of the line is y=mx+b , where y is the engineering units at a given point (measurement), m is the slope of the line that represents the linear ratio, x is the A/D value at a given point, and b is the fixed zero load offset of the sensor. In this example, enter 0.1338 for the slope and -282.36 for the offset for the units conversion values on the measured channel. 4 Distance Measurements with an Infrared (IR) Sensor and an Analog Input Technical Note Figure 7 - Slope and Offset Values 4. Enter Calibration Values and Verify 1. In the Node Commander channel configuration menu, select Custom Units for the Conversion Coefficients Class and Other for the units. 2. Select the Modify button to allow editing of the Slope and Offset fields. 3. Enter the calculated slope and offset values , and then select Lock to save the values. 4. Exit the configuration menus and resume sampling. 5. Verify the sensor measurements are accurate at a few known distances. Figure 8 - Entering Conversion Values Copyright © 2015 LORD Corporation Document 8401-0074 Revision C. Subject to change without notice. www.microstrain.com LORD Corporation MicroStrain® Sensing Systems ph: 802-862-6629 fax: 802-863-4093 sensing_sales@LORD.com sensing_support@LORD.com
