Student Directions for Moving Man Activity Name: http://phet
advertisement

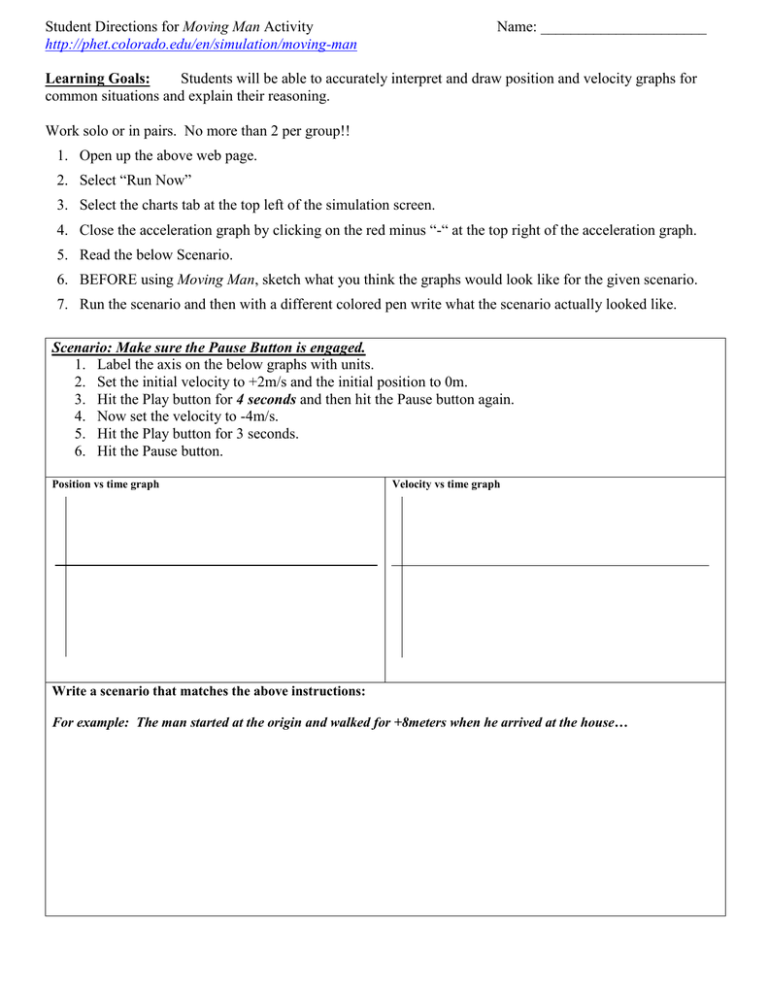
Student Directions for Moving Man Activity http://phet.colorado.edu/en/simulation/moving-man Name: ______________________ Learning Goals: Students will be able to accurately interpret and draw position and velocity graphs for common situations and explain their reasoning. Work solo or in pairs. No more than 2 per group!! 1. Open up the above web page. 2. Select “Run Now” 3. Select the charts tab at the top left of the simulation screen. 4. Close the acceleration graph by clicking on the red minus “-“ at the top right of the acceleration graph. 5. Read the below Scenario. 6. BEFORE using Moving Man, sketch what you think the graphs would look like for the given scenario. 7. Run the scenario and then with a different colored pen write what the scenario actually looked like. Scenario: Make sure the Pause Button is engaged. 1. Label the axis on the below graphs with units. 2. Set the initial velocity to +2m/s and the initial position to 0m. 3. Hit the Play button for 4 seconds and then hit the Pause button again. 4. Now set the velocity to -4m/s. 5. Hit the Play button for 3 seconds. 6. Hit the Pause button. Position vs time graph Velocity vs time graph Write a scenario that matches the above instructions: For example: The man started at the origin and walked for +8meters when he arrived at the house… Make new charts for each of the following scenarios. Predict what you think the graphs will look like, and then use Moving man to verify or correct your predicted graphs and reasoning with a different color pen. Scenario: Make sure the Pause Button is engaged. 1. Label the axis on the below graphs with units. 2. Set the initial velocity to +0m/s and the initial position to 0m. 3. Hit the Play button for 6 seconds and then hit the Pause button again. 4. Now set the velocity to +2m/s. 5. Hit the Play button for 4 seconds. 6. Hit the Pause button. 7. Now set the velocity to -10m/s. 8. Hit the Play button for 1 second. 9. Hit the Pause button. Position - time graph Velocity - time graph Write a scenario that matches the above instructions: Scenario: Make sure the Pause Button is engaged. 1. Label the axis on the below graphs with units. 2. Set the initial velocity to +2m/s and the initial position to -5m. 3. Hit the Play button for 5 seconds and then hit the Pause button again. 4. Now set the velocity to 0m/s. 5. Hit the Play button for 5 seconds. 6. Hit the Pause button. 7. Now set the velocity to -2.5m/s. 8. Hit the Play button for 4 seconds. 9. Hit the Pause button. Position - time graph Write a scenario that matches the above instructions: Velocity - time graph Scenario: The man stands still for 6 seconds while he talks on his cell phone at the middle of the sidewalk (origin), in an attempt to get better reception he then walks 5m toward the house taking 10 seconds to do so. At 16 seconds he comes to a sudden stop where the coverage is good and stands still to finish his conversation for another 30 seconds. Position - time graph Explain your reasoning for the graph’s appearance: Velocity - time graph Explain your reasoning for the graph’s appearance: Scenario: The man starts at the house and starts walking towards the tree. After 5 seconds he has reached the origin and stands still for 4 seconds. He then starts walking again toward the tree arriving there 16 seconds after he started his journey. He remains standing at the tree for another 14 seconds. Position - time graph Explain your reasoning for the graph’s appearance: Velocity - time graph Explain your reasoning for the graph’s appearance:
