View lab as pdf
advertisement
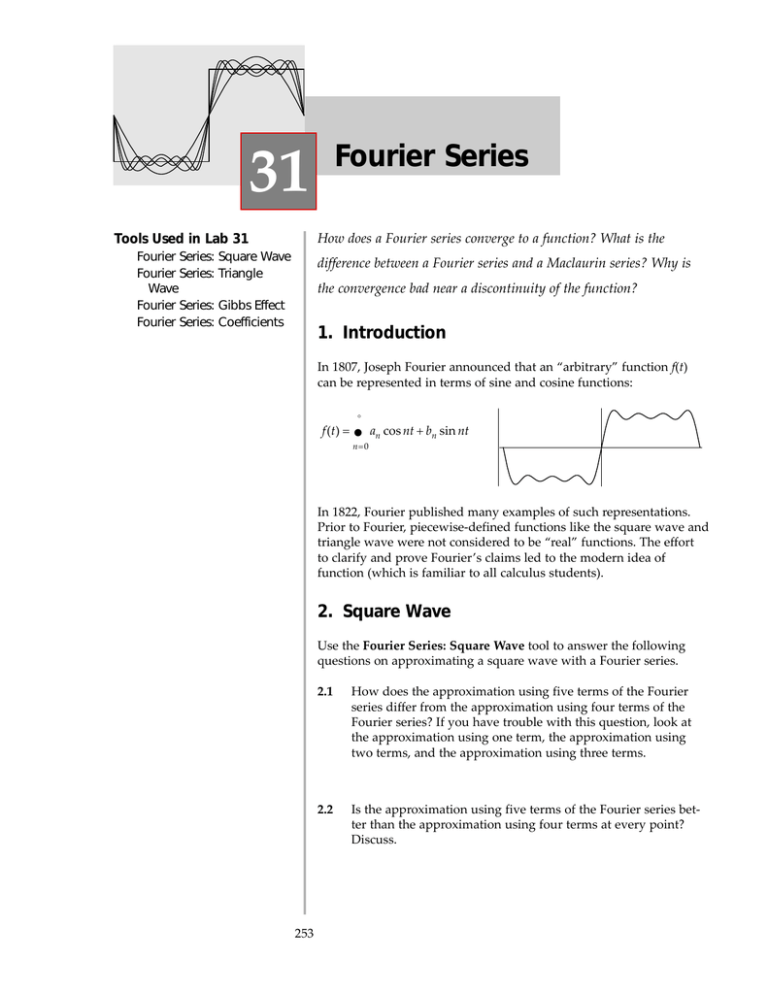
531 How does a Fourier series converge to a function? What is the Tools Used in Lab 31 Fourier Series: Fourier Series: Wave Fourier Series: Fourier Series: Fourier Series Square Wave Triangle difference between a Fourier series and a Maclaurin series? Why is the convergence bad near a discontinuity of the function? Gibbs Effect Coefficients 1. Introduction In 1807, Joseph Fourier announced that an “arbitrary” function f(t) can be represented in terms of sine and cosine functions: f (t ) = ∞ ∑ an cos nt + bn sin nt n=0 In 1822, Fourier published many examples of such representations. Prior to Fourier, piecewise-defined functions like the square wave and triangle wave were not considered to be “real” functions. The effort to clarify and prove Fourier’s claims led to the modern idea of function (which is familiar to all calculus students). 2. Square Wave Use the Fourier Series: Square Wave tool to answer the following questions on approximating a square wave with a Fourier series. 2.1 How does the approximation using five terms of the Fourier series differ from the approximation using four terms of the Fourier series? If you have trouble with this question, look at the approximation using one term, the approximation using two terms, and the approximation using three terms. There is one more wave between 0 and π. 2.2 Is the approximation using five terms of the Fourier series better than the approximation using four terms at every point? Discuss. No. At some points the approximation using four terms gives the square wave exactly, and the approximation using five terms is not exact. 253 254 Interactive Differential Equations 2.3 In what sense is the approximation using five terms better than the approximation using four terms? If one stays away from the discontinuities, the maximum error is less in the approximation using five terms. 2.4 In general, if one uses n terms of the Fourier series, how many waves (relative maxima) will there be between 0 and π? Relate your answer to the nth term of the series. There will be exactly as many waves in the approximation using n terms as in the nth term. 2.5 Does the maximum error decrease as the number of terms in the Fourier series approximation increases? Discuss. (The phenomenon that occurs here is called the Gibbs effect and occurs near any discontinuity of a function being approximated by a Fourier series.) No. The maximum error stays about the same, but occurs closer and closer to the discontinuity. 2.6 Does the square wave have a Maclaurin series expansion? Discuss. No. Taylor and Maclaurin series converge to continuous functions, and the square wave is not continuous at zero. 2.7 For what functions should one try to use Fourier series approximations and for what functions should one use Taylor series? Fourier series are used for periodic functions and can be used for most piecewise-continuous functions. For a function to have a Taylor series approximation, it need not be periodic but it has to be continuous and have derivatives of arbitrarily high order at every point in its interval of convergence. 3. Triangle Wave Use the Fourier Series: Triangle Wave tool to answer the following questions. 3.1 Is the approximation using five terms of the Fourier series better than the approximation using four terms at every point? Discuss. No. At some points the approximation using four terms gives the triangle wave exactly, and the approximation using five terms is not exact. 3.2 In what sense is the approximation using five terms better than the approximation using four terms? The maximum error is less in the approximation using five terms. 3.3 Does the maximum error decrease as the number of terms in the Fourier series approximation increases? Why does the Gibbs effect not occur? (See Section 4.) Yes. The Gibb’s effect only occurs near a point of discontinuity of the function. Lab 31 3.4 Fourier Series 255 Does the triangle wave have a Maclaurin series expansion? Discuss. No. Taylor and Maclaurin series converge to differentiable functions, and the triangle wave is not differentiable at zero. 4. Additional Exercises 4.1 By looking at the graphs of the square wave and the triangle wave, convince yourself that the square wave function is the derivative of the triangle wave function. Explain in words. 4.2 Verify that the Fourier series for the square wave can be obtained by differentiating the Fourier series for the triangle wave term by term. 5. Gibbs Effect The Gibbs effect is the spike that occurs in a Fourier series approximation near a discontinuity of a function. Use the Fourier Series: Gibbs Effect tool and the fact that the square wave is the derivative of the triangle wave (see Exercises 4.1 and 4.2) to convince yourself that the Gibbs effect has to occur and to answer the following questions. 5.1 Does the maximum error in the Fourier series approximation of the square wave go to zero or do you think it remains larger than some positive value? If so, estimate that value. The maximum error appears to remain larger than 0.179. (The overshoot is thus about 18%.) 5.2 How does the tip of the triangle wave (which occurs at t = π) manifest itself in the square wave and why? The derivative of the triangle wave changes from +1 to –1 at t = π, so the square wave, which is the derivative of the triangle wave, has a discontinuity, jumping in value from +1 to –1. 256 5.3 Interactive Differential Equations By examining the Fourier series approximation of the triangle wave near π, explain why the Gibbs effect has to occur in the square wave. The triangle wave is continuous, so the Fourier series approximation is uniform. The Fourier series approximation is smooth, so to uniformly approximate the triangle wave, the Fourier series approximation must make a tighter and tighter bend near the tip of the triangle wave. This forces a large maximum slope near where the graph of the approximation intersects the graph of the triangle in preparation for the tight bend. 6. Arbitrary Fourier Series The Fourier Series: Coefficients tool can be used to explore how the coefficients in a Fourier series are related to properties of the function. Good functions to play with are square waves, triangle waves, and sawtooth waves of various periods. Imagine a function shape and try to choose the coefficients, using the sliders to approximate the functions. Even functions have Fourier series involving only the constant term and the cosine terms. Odd functions have Fourier series involving only the sine terms. An arbitrary function can be expressed as the sum of an even and an old function. 6.1 Show that if f(t) is an arbitrary function then g(t) = f(t) = g(t) + h(t). , 6.2 f (t ) + f ( − t ) f (t ) − f ( − t ) is even, h(t) = is odd, and 2 2 , What distinguishes functions whose Fourier series involves only terms of the form sinnt with n even? with n odd? If a function has Fourier series involving only terms of the form sin nt with n even the function will be odd and periodic with period π. If a function has Fourier series involving only terms of the form sin nt with n odd, the function will be odd and have graph symmetric about the line 6.3 . What distinguishes functions whose Fourier series involves only terms of the form cosnt with n even? with n odd? If a function has Fourier series involving only terms of the form cos nt with n even, the function will be even and periodic with period π. If a function has Fourier series involving only terms of the form cos nt with n odd, the function will be even and have graph symmetric about the point Lab 31 Fourier Series 257 Lab 31: Tool Instructions Fourier Series: Square Wave Tool Buttons Click the mouse on a button in the upper group to view the graph of a partial series sum. Click the mouse on a button in the middle group to view overlays of partial series sums. Click the mouse on a button in the lower group to view graphs of individual series terms. Fourier Series: Triangle Wave Tool Buttons Click the mouse on a button in the upper group to view the graph of a partial series sum. Click the mouse on a button in the middle group to view overlays of partial series sums. Click the mouse on a button in the lower group to view graphs of individual series terms. Fourier Series: Gibbs Effect Tool Buttons Click the mouse on a button to view the graphs for a partial series sum. The upper graphs show the triangle wave, with magnification on the left to see Gibbs effect. The lower graphs show the square wave, derivative of the triangle wave, with the magnification on the left to see Gibbs effect. Fourier Series: Coefficients Tool Parameters Sliders Use the sliders to change the values for the parameters k and c. Press the mouse down on the slider knob for the parameter you want to change and drag the mouse back and forth, or click the mouse in the slider channel at the desired value for the parameter. Buttons Click the mouse on the [Cosine Series] or [Sine Series] buttons to choose a series. Click the mouse on the lower set of buttons to select which terms to display: all, odd, or even. 258 Interactive Differential Equations
