The New York City Department of Education (NYC DOE), part of city
advertisement

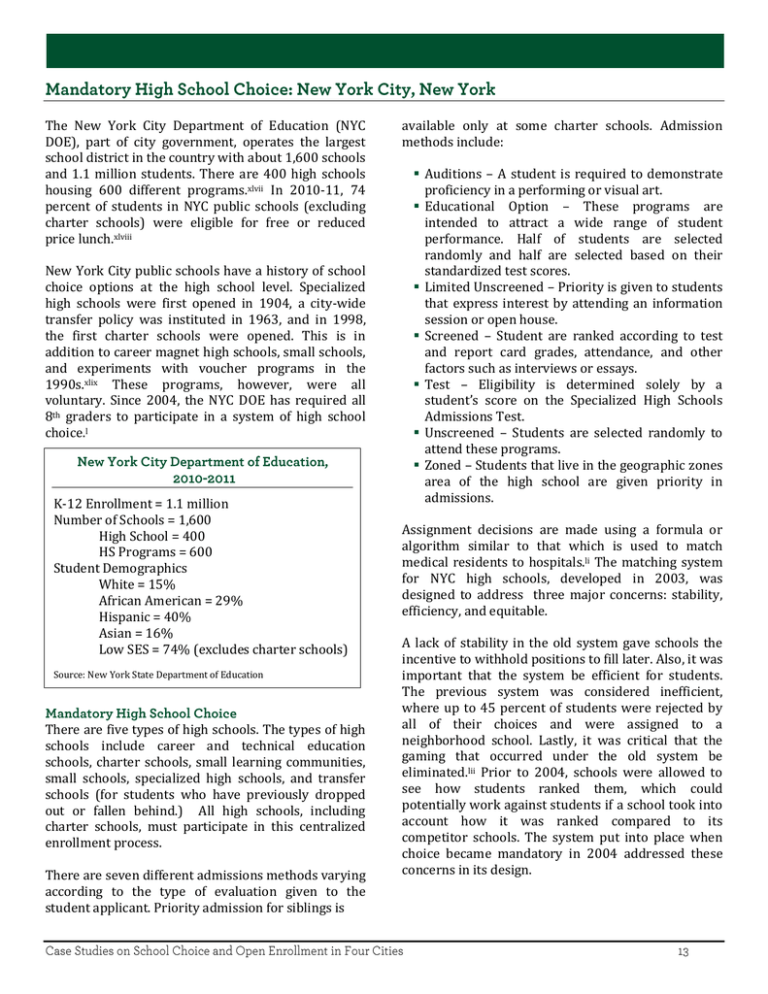
The New York City Department of Education (NYC DOE), part of city government, operates the largest school district in the country with about 1,600 schools and 1.1 million students. There are 400 high schools housing 600 different programs.xlvii In 2010-11, 74 percent of students in NYC public schools (excluding charter schools) were eligible for free or reduced price lunch.xlviii New York City public schools have a history of school choice options at the high school level. Specialized high schools were first opened in 1904, a city-wide transfer policy was instituted in 1963, and in 1998, the first charter schools were opened. This is in addition to career magnet high schools, small schools, and experiments with voucher programs in the 1990s.xlix These programs, however, were all voluntary. Since 2004, the NYC DOE has required all 8th graders to participate in a system of high school choice.l K-12 Enrollment = 1.1 million Number of Schools = 1,600 High School = 400 HS Programs = 600 Student Demographics White = 15% African American = 29% Hispanic = 40% Asian = 16% Low SES = 74% (excludes charter schools) Source: New York State Department of Education There are five types of high schools. The types of high schools include career and technical education schools, charter schools, small learning communities, small schools, specialized high schools, and transfer schools (for students who have previously dropped out or fallen behind.) All high schools, including charter schools, must participate in this centralized enrollment process. There are seven different admissions methods varying according to the type of evaluation given to the student applicant. Priority admission for siblings is available only at some charter schools. Admission methods include: Auditions – A student is required to demonstrate proficiency in a performing or visual art. Educational Option – These programs are intended to attract a wide range of student performance. Half of students are selected randomly and half are selected based on their standardized test scores. Limited Unscreened – Priority is given to students that express interest by attending an information session or open house. Screened – Student are ranked according to test and report card grades, attendance, and other factors such as interviews or essays. Test – Eligibility is determined solely by a student’s score on the Specialized High Schools Admissions Test. Unscreened – Students are selected randomly to attend these programs. Zoned – Students that live in the geographic zones area of the high school are given priority in admissions. Assignment decisions are made using a formula or algorithm similar to that which is used to match medical residents to hospitals.li The matching system for NYC high schools, developed in 2003, was designed to address three major concerns: stability, efficiency, and equitable. A lack of stability in the old system gave schools the incentive to withhold positions to fill later. Also, it was important that the system be efficient for students. The previous system was considered inefficient, where up to 45 percent of students were rejected by all of their choices and were assigned to a neighborhood school. Lastly, it was critical that the gaming that occurred under the old system be eliminated.lii Prior to 2004, schools were allowed to see how students ranked them, which could potentially work against students if a school took into account how it was ranked compared to its competitor schools. The system put into place when choice became mandatory in 2004 addressed these concerns in its design. Every incoming freshman, as well as any 9th graders who wishes to transfer schools for 10th grade, must fill out an application in the early fall of their 8th or 9th grade year and return it to their school’s guidance counselor by the early December deadline. The NYC DOE advises that students begin to think about their high school choices in the 6th grade. Students are able to select and rank up to 12 programs from the High School Directory they receive at the end of 7th grade. Additionally, each school ranks the applicants according to the order in which they would admit those students, without seeing where the applicants have ranked them.liii Three admissions rounds are held each year after the application deadline of early December. In the first round, all students are included and an attempt is made to match each student with one of their high schools of choice. If a match cannot be made by the algorithm in the first round, students are allowed to select 12 more schools in the supplementary round and another attempt at matching is made. After this round, every student will have received a high school match. Lastly, parents may appeal the final match through a process instigated with their child’s guidance counselor.liv The appeals process can last through the end of June.lv Mid-year transfers (and, seemingly, transfers after the 10th grade) are only allowed in cases where the student has been injured in a fight documented by a police report, has a doctor’s note stating that their health is threatened in some way, or has a commute of more than 90 minutes, per NYC DOE policy. Principals cannot admit a student mid-year and all transfers must be routed through and approved by the central office. There are no waiting lists for any high schools.lvi Like any school choice model, to fully take advantage of the NYC DOE system requires that a student have a parent that is engaged, available, and able to read and understand key documents to assist in the process of choosing and ranking schools. Even parents who were involved in the process found it “overwhelming, stressful, or confusing,” according to a 2009 study conducted by the Center for New York City Affairs at the New School.lvii In addition, feelings of being overwhelmed were echoed by the middle school guidance counselors interviewed by researchers in 2009. Middle school guidance counselors reported that they had been required to handle up to 300 to 400 student applications. They professed having little time to adequately review the applications.lviii Researchers recorded that guidance counselors felt ill-equipped to advise parents; one said that they know no more about high schools than what is published in the annual guide. Most problematically, however, was guidance counselors’ belief that there is a lack of good options for average or low achieving students. One counselor said, “In Manhattan, there are only a handful of schools [for average or below-average students] that I would send my own children to. The rest, you take your chances.”lix In 2011, 83 percent of students were matched to one of their top five choices and an additional seven percent were matched to other schools on their list. About 10 percent of the city’s 8th graders did not receive admission to any of their choices in the initial round. They were given an additional two weeks to select and apply to 12 different schools that still had remaining spots. There has been a small but steady increase in the number of students who are not matched with any of the schools on their lists.lx Part of the high school choice strategy has been to identify under-chosen and under-performing schools and to target these for closure. Through 2009, officials closed more than 20 large, poorly-performing comprehensive high schools and introduced a number of new smaller high schools and programs. The competition for students is expected to encourage high school principals and staff to make themselves more attractive to students by increasing their course offerings or instituting specialized programs.lxi However, the Center for New York City Affairs study found that the introduction of these new schools and the closure of the larger schools has led to overcrowding and declining attendance and graduation rates at some of the remaining large high schools.lxii That same study, conducted in 2009, focused on the implementation of both school choice and the small schools movement in NYC high schools.lxiii The review of the choice system was based on 165 interviews and identified elements of the design and execution of the system that appeared flawed. The study asserts that the NYC DOE did not have a formal mechanism for assigning students with special needs to schools that had the capacity to serve them. A survey conducted by the DOE found that 35 percent of principals that responded said they did not have the special education services in their schools to meet their students’ needs.lxiv The 2009 study also found fault with the policies for student transfers and assigning latecomers to schools. The policy of denying transfers to students without a doctor’s note, police report, or 90 minute commute, they claim, had the effect of trapping students in poorperforming schools, contrary to the stated purpose of school choice. Researchers found anecdotal evidence through their interviews that troubled students, those at risk of dropping out, and students with special medical accommodations were denied transfers by the NTC DOE, or experienced significant difficulty in obtaining them, even in cases where the principal of the new school welcomed the student.lxv Overall, however, the 2009 study found an increase in positive academic outcomes and achievement after the introduction of mandatory high school choice. The graduation rate climbed from 41 percent in 2004 to 56 percent in 2008. Additionally, the achievement gap between white and African-American and white and Latino students narrowed over the same four years.lxvi A 2011 study by researchers at New York and Columbia Universities analyzed four years of studentlevel administrative data, from 2004 to 2008, to gain insight about who is participating, how students are ranking schools, and where students are placed, and how these answers vary according to race, poverty, and other student characteristics.lxvii They found that about 21 percent of 8th graders rank 12 schools while 7 percent rank only one. However, 82 percent of the students listing one school were matched to that school. This is probably because the students were applying to their zoned school or to continue to 9th grade at their current school. The study also found that economically and academically disadvantaged students tended to rank more schools. In May 2011, the New York Times in an article titled “Lost in the School Choice Maze,” cited the above study, analyzes the choice process for students who participated in the supplemental round. A department spokesperson quoted in the article said it was unclear why so many students went unmatched, but that it could be a combination of factors such as, “listing too few choices, overconfidence at reaching the choices for which they might not have qualified, the information available based on their record.” Parents quoted in the piece, titled “Lost in the School Choice Maze,” described the difficulty of navigating the process. The problem, summed up by one expert, is that there are simply not enough “good” schools for the average student. Even students with good grades, high test scores, and reasonable school selections went unmatched, a problem also found by researchers at the Center for New York City Affairs.lxviii Students generally tended to rank high schools that had student bodies similar to their own, academically as well as according to race and socioeconomic status. While they often ranked more advantaged schools as their first choice, they were most likely to be placed in schools that looked similar to their middle school. Students with low academic achievement were more likely to rank schools with poor academic outcomes and largely low-income student bodies. Interestingly, white students and English language learners were more likely to rank the school closest to their home as first on their lists. The study concludes that school choice has become more equitable and transparent under the system instituted in 2004, but that transparency has not reduced its complexity. lxix Chad Aldeman and Thomas Toch, Matchmaking: Enabling Mandatory Public School Choice in New York and Boston, Education Sector, September 2009. ii Ibid. iii School Innovation and Turnaround Committee Agenda, Board of Elementary and Secondary Education, October 18, 2011, pp. 186-189. iv New Orleans Parent Organizing Network, New Orleans Parents’ Guide to Public Schools, Spring 2011 Edition. v Andrew Vanacore, “New Orleans charter schools taking their time to set up attendance zones,” The New Orleans TimesPicayune, May 5, 2011. vi Ibid. vii G.C.R. and Associates, Inc., School Facilities Master Plan Update Demographic Study, January 2011. viii Massachusetts Department of Elementary and Secondary Education, “School/District Profiles: Cambridge” http://profiles.doe.mass.edu/profiles/general.aspx?topNavId=1&orgcode=00490000&orgtypecode=5& (accessed July 11, 2011) ix Norma Tan, “The Cambridge Controlled Choice Program: Improving Educational Equity and Integration,” Manhattan Institute Center for Educational Innovation, (1990). x Tan. xi “Controlled Choice Plan,” Cambridge Public Schools, (2001). xii Mary Hurley, “School Chief: Use income to place students,” The Boston Globe, October 14, 2001. xiii Richard Kahlenberg, “The new integration,” Educational Leadership (2006): 22. xiv RW Rumberger and GJ Palardy, “Does segregation still matter? The impact of student composition on academic achievement in high school,” Teachers College Record, 107, (2005): 1999-2045. xv Cambridge Public Schools, “Controlled Choice Plan.” xvi Cambridge Public Schools Administrative Offices, “Schools At a Glance,” Office of Public Information and Communication, (2010). xvii Cambridge Public Schools, “Controlled Choice Plan.” xviii Cambridge Public Schools “Schools at a Glance.” xix Ibid. xx Cambridge Public Schools, “Controlled Choice Plan.” xxi Cambridge Public Schools, “Schools At a Glance.” xxii CPSD, FY 2008-09 Budget – Adopted by the School Committee on April 15, 2008; CPSD FY 2011-12 Budget – Adopted by the School Committee on April 5, 2011. xxiii Cambridge Public Schools, “Controlled Choice Plan.” xxiv Tan. xxv Edward Fiske, “Controlled Choice in Cambridge, Massachusetts,” Century Foundation Press, September 2002. xxvi Ibid. xxvii Tan. xxviii Massachusetts Department of Elementary and Secondary Education, “School/District Profiles: Cambridge.” xxix Fiske. xxx Massachusetts Department of Elementary and Secondary Education, “School/District Profiles: Cambridge.” xxxi Tan. xxxii Fiske. xxxiii Brian P. Nanos, “Cambridge schools begin controlled choice makeover,” Wicked Local: Cambridge, October 27, 2010. xxxiv “San Diego Unified School District: Fast Facts” San Diego Unified School District, 2011. http://www.sandi.net/20451072095932967/site/default.asp (accessed July 12, 2011). xxxv San Diego Unified School District, “Enrollment Options Catalog: Application Process,” 2008: 2. xxxvi “San Diego Unified School District: Enrollment Option,s” San Diego Unified School District, 2011. http://www.sandi.net/20451072011450793/site/default.asp?20451072011450793Nav=|&NodeID=6239 (accessed July 12, 2011). xxxvii “San Diego Unified School District: Enrollment Options/ School Choice Policies. Programs,” San Diego Unified School District, 2011. http://www.sandi.net/20451072011450793/blank/browse.asp?a=383&BMDRN=2000&BCOB=0&c=64990&2045107201 1450793Nav=|&NodeID=3631 (accessed July 12, 2011). i Maureen Magee, “School choice programs require plenty of homework for parents,” San Diego Union-Tribune, December 2005. xxxix Julian R. Betts, Lorien A. Rice, Andrew C. Zau, Y. Emily Tang, and Cory R. Koedel, “Does School Choice Work? Effects on Student Integration and Achievement,” Public Policy Institute of California, 2006: vi. xl Betts, et al. xli Ibid. xlii Ibid. xliii Ibid. xliv Ibid. xlv Ibid. xlvi Cory Koedel, Julian R. Betts, Lorien A. Rice, and Andrew C. Zau, “The Social Cost of Open Enrollment as a School Choice Policy,” April 2010. xlvii “Choices and Enrollment,” New York City Department of Education. http://schools.nyc.gov/choicesenrollment, (accessed July 18, 2011). xlviii Private correspondence, Ellen Martin, Information and Reporting Services, New York State Department of Education, July 2011. xlix Sean Corcoran and Henry Levin, “School Choice and Competition in New York City Schools,” in Education Reform in New York City: Ambitious Change in the Nation’s Most Complex School System, edited by Jennifer A. O’Day, Catherine S. Bitter, and Louis M. Gomez, Harvard Education Press, 2011. l Ibid. li Liz Robbins, “Lost in the School Choice Maze,” New York Times, May 6, 2011. lii Atila Abdulkadiroglu, Parag A. Pathak, and Alvin E. Roth, Strategy-Proofness Versus Efficiency in Matching with Indifferences: Redesigning the New York City High School Match, Working Paper 14684, National Bureau of Economic Research, April 2009. liii “High School Admissions: Frequently Asked Questions,” New York City Department of Education, http://schools.nyc.gov/choicesenrollment/high/default.htm (accessed July 18, 2011), and Corcoran and Levin, 2011. liv “Choices and Enrollment,” New York City Department of Education. lv Robbins, 2011. lvi Clara Hemphill, et. al., The New Marketplace: How Small-School Reforms and School Choice Have Reshaped New York City’s High Schools, The Center for New York City Affairs at the New School, June 2009. lvii Ibid. lviii Ibid. lix Ibid. lx Robbins, 2011. lxi Aldeman and Toch, 2009. lxii Hemphill, 2009. lxiii Ibid. lxiv Ibid. lxv Ibid. lxvi Ibid. lxvii Corcoran and Levin, 2011. lxviii Hemphill, 2009. lxix Ibid. xxxviii


