Equilibrium Moisture Content Charts for Grain Storage
advertisement

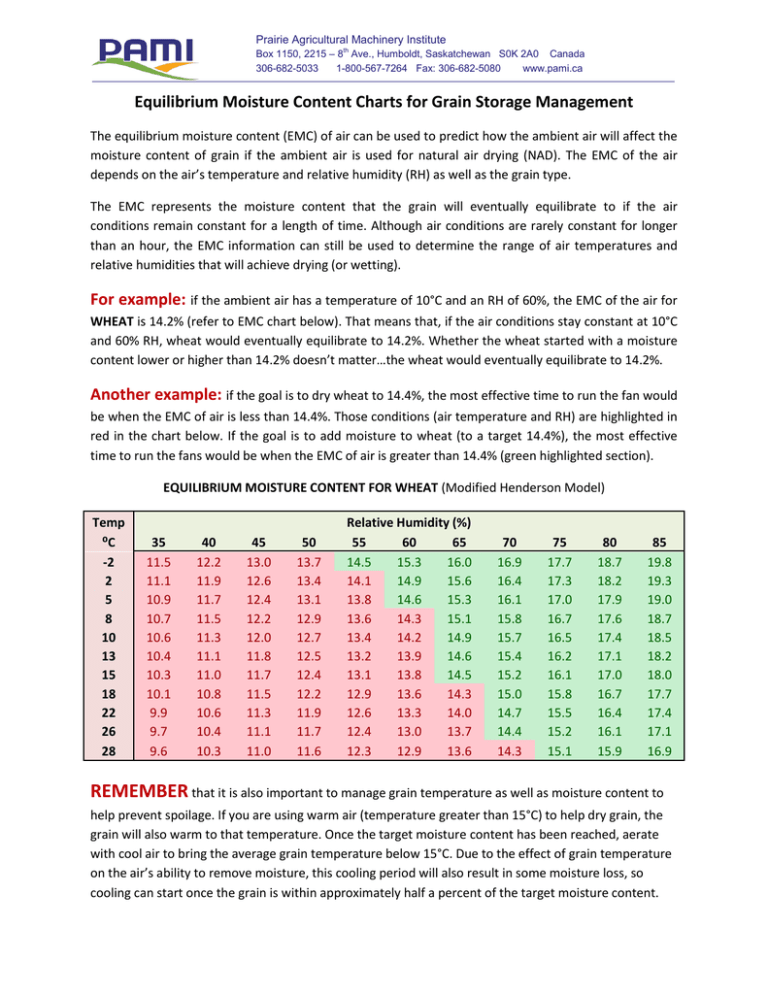
Prairie Agricultural Machinery Institute Box 1150, 2215 – 8th Ave., Humboldt, Saskatchewan S0K 2A0 Canada 306-682-5033 1-800-567-7264 Fax: 306-682-5080 www.pami.ca Equilibrium Moisture Content Charts for Grain Storage Management The equilibrium moisture content (EMC) of air can be used to predict how the ambient air will affect the moisture content of grain if the ambient air is used for natural air drying (NAD). The EMC of the air depends on the air’s temperature and relative humidity (RH) as well as the grain type. The EMC represents the moisture content that the grain will eventually equilibrate to if the air conditions remain constant for a length of time. Although air conditions are rarely constant for longer than an hour, the EMC information can still be used to determine the range of air temperatures and relative humidities that will achieve drying (or wetting). For example: if the ambient air has a temperature of 10°C and an RH of 60%, the EMC of the air for WHEAT is 14.2% (refer to EMC chart below). That means that, if the air conditions stay constant at 10°C and 60% RH, wheat would eventually equilibrate to 14.2%. Whether the wheat started with a moisture content lower or higher than 14.2% doesn’t matter…the wheat would eventually equilibrate to 14.2%. Another example: if the goal is to dry wheat to 14.4%, the most effective time to run the fan would be when the EMC of air is less than 14.4%. Those conditions (air temperature and RH) are highlighted in red in the chart below. If the goal is to add moisture to wheat (to a target 14.4%), the most effective time to run the fans would be when the EMC of air is greater than 14.4% (green highlighted section). EQUILIBRIUM MOISTURE CONTENT FOR WHEAT (Modified Henderson Model) Temp ⁰C -2 2 5 8 10 13 15 18 22 26 28 35 11.5 11.1 10.9 10.7 10.6 10.4 10.3 10.1 9.9 9.7 9.6 40 12.2 11.9 11.7 11.5 11.3 11.1 11.0 10.8 10.6 10.4 10.3 45 13.0 12.6 12.4 12.2 12.0 11.8 11.7 11.5 11.3 11.1 11.0 50 13.7 13.4 13.1 12.9 12.7 12.5 12.4 12.2 11.9 11.7 11.6 Relative Humidity (%) 55 60 65 14.5 15.3 16.0 14.1 14.9 15.6 13.8 14.6 15.3 13.6 14.3 15.1 13.4 14.2 14.9 13.2 13.9 14.6 13.1 13.8 14.5 12.9 13.6 14.3 12.6 13.3 14.0 12.4 13.0 13.7 12.3 12.9 13.6 70 16.9 16.4 16.1 15.8 15.7 15.4 15.2 15.0 14.7 14.4 14.3 75 17.7 17.3 17.0 16.7 16.5 16.2 16.1 15.8 15.5 15.2 15.1 80 18.7 18.2 17.9 17.6 17.4 17.1 17.0 16.7 16.4 16.1 15.9 85 19.8 19.3 19.0 18.7 18.5 18.2 18.0 17.7 17.4 17.1 16.9 REMEMBER that it is also important to manage grain temperature as well as moisture content to help prevent spoilage. If you are using warm air (temperature greater than 15°C) to help dry grain, the grain will also warm to that temperature. Once the target moisture content has been reached, aerate with cool air to bring the average grain temperature below 15°C. Due to the effect of grain temperature on the air’s ability to remove moisture, this cooling period will also result in some moisture loss, so cooling can start once the grain is within approximately half a percent of the target moisture content. Prairie Agricultural Machinery Institute Box 1150, 2215 – 8th Ave., Humboldt, Saskatchewan S0K 2A0 Canada 306-682-5033 1-800-567-7264 Fax: 306-682-5080 www.pami.ca The EMC charts for wheat, barley, peas, canola and oats are shown below. These charts are based on the moisture isotherm data summarized in the ASAE Standard D245.5 (Moisture Relationships of Plantbased Agricultural Products). These charts use the Modified Henderson model for peas, wheat, canola/rapeseed and barley and the Modified Chung model for oats. Note that the information in ASAE Standard D245.5 is based on research conducted in the 1980’s and 1990’s. Since that time, plant breeding has resulted in different starch and oil contents of grains and oilseeds which may affect the EMC values. Therefore, these charts should be used as a guideline only. EQUILIBRIUM MOISTURE CONTENT FOR WHEAT Temp ⁰C -2 2 5 8 10 13 15 18 22 26 28 35 11.5 11.1 10.9 10.7 10.6 10.4 10.3 10.1 9.9 9.7 9.6 40 12.2 11.9 11.7 11.5 11.3 11.1 11.0 10.8 10.6 10.4 10.3 45 13.0 12.6 12.4 12.2 12.0 11.8 11.7 11.5 11.3 11.1 11.0 50 13.7 13.4 13.1 12.9 12.7 12.5 12.4 12.2 11.9 11.7 11.6 Relative Humidity (%) 55 60 65 14.5 15.3 16.0 14.1 14.9 15.6 13.8 14.6 15.3 13.6 14.3 15.1 13.4 14.2 14.9 13.2 13.9 14.6 13.1 13.8 14.5 12.9 13.6 14.3 12.6 13.3 14.0 12.4 13.0 13.7 12.3 12.9 13.6 70 16.9 16.4 16.1 15.8 15.7 15.4 15.2 15.0 14.7 14.4 14.3 75 17.7 17.3 17.0 16.7 16.5 16.2 16.1 15.8 15.5 15.2 15.1 80 18.7 18.2 17.9 17.6 17.4 17.1 17.0 16.7 16.4 16.1 15.9 85 19.8 19.3 19.0 18.7 18.5 18.2 18.0 17.7 17.4 17.1 16.9 80 15.8 15.6 15.5 15.4 15.4 15.3 15.2 15.1 15.0 14.9 14.8 85 16.9 16.7 16.6 16.5 16.5 16.4 16.3 16.2 16.1 16.0 15.9 EQUILIBRIUM MOISTURE CONTENT FOR BARLEY Temp ⁰C -2 2 5 8 10 13 15 18 22 26 28 35 8.9 8.8 8.7 8.7 8.6 8.6 8.5 8.5 8.4 8.3 8.3 40 9.6 9.5 9.4 9.4 9.3 9.3 9.2 9.2 9.1 9.0 9.0 45 10.3 10.2 10.1 10.0 10.0 9.9 9.9 9.8 9.7 9.7 9.6 50 11.0 10.9 10.8 10.7 10.7 10.6 10.6 10.5 10.4 10.3 10.3 Relative Humidity (%) 55 60 65 11.7 12.4 13.1 11.6 12.3 13.0 11.5 12.2 12.9 11.4 12.1 12.9 11.4 12.1 12.8 11.3 12.0 12.7 11.2 11.9 12.7 11.2 11.9 12.6 11.1 11.8 12.5 11.0 11.7 12.4 11.0 11.6 12.4 70 13.9 13.8 13.7 13.6 13.6 13.5 13.5 13.4 13.3 13.2 13.1 75 14.8 14.7 14.6 14.5 14.4 14.3 14.3 14.2 14.1 14.0 13.9 Prairie Agricultural Machinery Institute Box 1150, 2215 – 8th Ave., Humboldt, Saskatchewan S0K 2A0 Canada 306-682-5033 1-800-567-7264 Fax: 306-682-5080 www.pami.ca EQUILIBRIUM MOISTURE CONTENT FOR PEAS Temp ⁰C -2 2 5 8 10 13 15 18 22 26 28 35 9.5 9.4 9.2 9.1 9.1 8.9 8.9 8.8 8.6 8.5 8.4 40 10.7 10.6 10.4 10.3 10.2 10.1 10.0 9.9 9.8 9.6 9.5 45 12.0 11.8 11.6 11.5 11.4 11.3 11.2 11.1 10.9 10.7 10.7 50 13.3 13.0 12.9 12.7 12.6 12.5 12.4 12.3 12.1 11.9 11.8 Relative Humidity (%) 55 60 65 14.6 16.0 17.5 14.4 15.7 17.2 14.2 15.6 17.0 14.0 15.4 16.8 13.9 15.3 16.7 13.8 15.1 16.5 13.7 15.0 16.4 13.5 14.8 16.2 13.3 14.6 16.0 13.1 14.4 15.8 13.0 14.3 15.7 70 19.1 18.8 18.6 18.4 18.2 18.1 17.9 17.7 17.5 17.2 17.1 75 20.9 20.6 20.3 20.1 20.0 19.7 19.6 19.4 19.1 18.9 18.8 80 22.9 22.5 22.3 22.1 21.9 21.7 21.5 21.3 21.0 20.8 20.6 85 25.2 24.9 24.6 24.4 24.2 23.9 23.8 23.6 23.2 23.0 22.8 75 14.4 14.1 13.9 13.7 13.5 13.3 13.2 13.0 12.8 9.9 9.7 80 15.3 15.0 14.7 14.5 14.4 14.2 14.1 13.9 13.7 10.8 10.7 85 16.3 16.0 15.8 15.6 15.5 15.3 15.2 15.0 14.8 12.0 11.9 EQUILIBRIUM MOISTURE CONTENT FOR OATS Temp ⁰C -2 2 5 8 10 13 15 18 22 26 28 35 9.8 9.4 9.2 9.0 8.8 8.6 8.4 8.2 8.0 4.6 4.5 40 10.3 10.0 9.7 9.5 9.3 9.1 9.0 8.8 8.5 5.2 5.0 45 10.8 10.5 10.2 10.0 9.8 9.6 9.5 9.3 9.0 5.8 5.6 50 11.3 11.0 10.8 10.5 10.4 10.2 10.0 9.8 9.6 6.4 6.2 Relative Humidity (%) 55 60 65 11.9 12.4 13.0 11.5 12.1 12.7 11.3 11.9 12.5 11.1 11.6 12.2 10.9 11.5 12.1 10.7 11.3 11.9 10.6 11.2 11.8 10.4 11.0 11.6 10.1 10.7 11.4 7.0 7.6 8.3 6.8 7.5 8.2 70 13.7 13.4 13.1 12.9 12.8 12.6 12.4 12.3 12.0 9.0 8.9 Prairie Agricultural Machinery Institute Box 1150, 2215 – 8th Ave., Humboldt, Saskatchewan S0K 2A0 Canada 306-682-5033 1-800-567-7264 Fax: 306-682-5080 www.pami.ca EQUILIBRIUM MOISTURE CONTENT FOR CANOLA/RAPESEED Temp ⁰C -2 2 5 8 10 13 15 18 22 26 28 35 6.7 6.4 6.1 5.9 5.7 5.5 5.4 5.2 5.0 4.8 4.8 40 7.5 7.0 6.8 6.5 6.3 6.1 6.0 5.8 5.6 5.4 5.3 45 8.2 7.7 7.4 7.1 7.0 6.7 6.6 6.4 6.1 5.9 5.8 50 8.9 8.4 8.1 7.8 7.6 7.3 7.2 7.0 6.7 6.5 6.3 55 9.7 9.1 8.8 8.5 8.3 8.0 7.8 7.6 7.3 7.0 6.9 Relative Humidity (%) 60 65 70 10.5 11.3 12.2 9.9 10.7 11.6 9.5 10.3 11.1 9.2 9.9 10.7 8.9 9.7 10.5 8.6 9.4 10.1 8.5 9.2 9.9 8.2 8.9 9.6 7.9 8.5 9.3 7.6 8.2 8.9 7.5 8.1 8.8 75 13.2 12.5 12.0 11.6 11.3 11.0 10.7 10.4 10.0 9.7 9.5 80 14.3 13.6 13.1 12.6 12.3 11.9 11.7 11.3 10.9 10.5 10.4 85 15.7 14.9 14.3 13.8 13.5 13.1 12.8 12.4 12.0 11.6 11.4 If you have any questions about the information presented in this document, please contact Dr. Joy Agnew at PAMI. Email jagnew@pami.ca or phone (306) 682-5033 ext 280.


